Rest in Peace Russell Steele

E464F304-2A85-41B1-B3DE-C52005F5C45A

Hello,

It is with a heavy heart that we share the news of Russ’s passing on January 3rd, 2020. He was at home and surrounded by all his loved ones when he went. His general level of health and post-surgical complications took him sooner than any of us could have expected.

Thank you, Russ’s Family

Two Sunspots From Solar Cycle-25

Spaceweather.com has the details HERE.

Solar Cycle 25 really is coming. Today, for the first time, there are two new-cycle sunspots on the solar disk–one in each hemisphere. This map of solar magnetic fields from NASA’s Solar Dynamics Observatory shows their location:

magnetogram_strip

We know these sunspots belong to the next solar cycle because of their magnetic polarity. Simply put, they are backwards. According to Hale’s Law, sunspot polarities flip-flop from one solar cycle to the next. During old Solar Cycle 24, we grew accustomed to sunspots in the sun’s southern hemisphere having a -/+ pattern. However, look at today’s southern sunspot:

newspot_strip

It is the opposite: +/-. This identifies it as a member of new Solar Cycle 25.

Likewise, today’s northern sunspot has a reversed polarity compared to northern spots from old Solar Cycle 24. It, too, therefore, belongs to Solar Cycle 25.

The sun is currently in Solar Minimum–the nadir of the 11-year sunspot cycle. It’s a deep Minimum, century-class according to sunspot counts. The scarcity of sunspots has been so remarkable that it has prompted discussion of a possible “extended Minimum” akin to the Maunder Minimum of the 17th century when sunspots were absent for decades. Such an event could have implications for terrestrial climate.

Today’s new-cycle sunspots (along with isolatednew-cycle spots earlier this year) suggest that the solar cycle is, in fact, unfolding normally. A new Maunder Minimum does not appear to be in the offing. Forecasters expect Solar Cycle 25 to slowly gain strength in the years ahead and reach a peak in July 2025.

Your thoughts.  The Maunder Minimum was not observed with the technology available today, small spots like these could have been missed. What do you think?

NOAA Signs With Three Cloud Companies to Provide Free Access to Its Data.

The National Oceanic and Atmospheric Administration announced a new milestone in its big data program, enabling more access to its ever-growing troves of data in the hopes of sparking new economies and a better understanding of our environment.

The agency launched the Big Data Project as a way to push the petabytes of data it collects daily out to people who could use it. The program is based on the idea that NOAA—and the Commerce Department in general—collects the sort of data that is of interest to researchers and entrepreneurs alike.

NOAA penned a deal in 2015 with five cloud service providers to develop a pipeline for its data to be stored in those cloud providers’ systems, then be made available to the public at no cost. While the partners are not allowed to charge for access to the data, they could charge for value-added content, in much the way weather data is used by industry today.

On Thursday, NOAA announced awards to Amazon Web Services, Google Cloud and Microsoft under multiyear contracts to host NOAA data for public use.

“The Big Data Project’s cloud service providers have shown incredible commitment to open data principles, and they clearly understand the value of NOAA’s data to their customers and to the Nation’s economy,” Ed Kearns, acting chief data officer at the Commerce Department, said in a statement Thursday.

Source: NextGov.com


Solar Update December 2019

Reblogged from Watts Up With That

David Archibald

We are well into the Solar Cycle 24/25 minimum but 24 may not have ended yet. A solar cycle isn’t over until the heliospheric current sheet has flattened. And that could be as late as March 2021. Solar cycle amplitude does matter with respect to climate and the amplitude of Solar Cycle 25, from projecting trends from the last three cycles, looks like being about 80 in 2027.

clip_image002

Figure 1: F10.7 flux 2014 to 2019

The F10.7 flux has been flat for a couple of years now. What is interesting is that a low of 63.4 was recorded on 21st October, which may be a low for the instrumental record. Since then the F10.7 has been in a narrow range from 68 to 70.

clip_image004

Figure 2: Heliospheric current sheet tilt angle 1976 to 2019

The solar cycle isn’t over until the heliospheric current sheet tilt angle has flattened and as at Carrington rotation 2224, the tilt angle was still a few degrees from having flattened. If the date of flattening is constrained by the slope of the decline from the cycle peak then the latest date for flattening is March 2021.

clip_image006

Figure 3: Ap Index 1980 – 2019

This figure shows the break in the Ap Index in 2006 at the end of the Modern Warm Period to the New Cold Period. It also shows the relationship between month of heliospheric current sheet flattening (red arrows) and the month of minimum as determined by the low in sunspot activity (green arrows) which is far more subjective.

clip_image008

Figure 4: Aligned heliospheric current sheet tilt angle by month of minimum

Solar Cycle 23 was stronger for longer while Solar Cycle 24 is largely tracking 21 and 22, suggesting the end may be soon.

clip_image010Figure 5: Solar hemispheric sunspot area and F10.7 flux 1985 – 2019

This figure is included to show that solar activity, as measured by the F10.7 flux, is directly proportional to the sum of the sunspot areas of the solar northern and southern hemispheres. Sunspot number is proportional to F10.7 flux but is a less precise measure.

clip_image012

Figure 6: Sunspot area by solar hemisphere 1985 to 2019

In this figure the hemispheric sunspot areas are plotted individually instead of cumulatively. What is readily apparent is that each hemisphere has been driven by its own trend in activity – the peaks of both cycles all line up. Which begs the question of what will happen if those trends in activity continue? In Solar Cycle 24 the peak of northern hemispheric activity occurred three years before that of the southern hemisphere. If that repeats in Solar Cycle 25 with the amplitude of each hemisphere constrained by the blue trend lines, then the northern hemisphere would peak in 2024 with an amplitude of 200 millionths of the solar hemispheric area and the southern hemisphere would peak in 2027 with an amplitude of 600 millionths of the solar hemispheric area. For the whole solar cycle, the peak amplitude would be in 2027 with a smoothed sunspot number of 80, down a third from Solar Cycle 24.

clip_image014

Figure 7: Sunspot area by hemisphere 1874 to 1924

This figure is included to show that trends in hemispheric sunspot activity can hold for nearly four solar cycles as shown by the southern solar hemisphere (red line) from the late 19th century.

clip_image016

Figure 8: Oulu Neutron Count 1964 to 2019

This is the main part of where the rubber meets the road in terms of the effect of solar activity on climate. Weaker solar activity, as is predicted for Solar Cycle 25, means that more galactic cosmic rays make it into the inner planets of the solar system instead of being pushed away by the Sun’s magnetic flux carried on the solar wind. The shower of neutrons in the lower atmosphere increases and provides more nucleation sites for cloud droplets. The increased cloud cover reflects more sunlight and the Earth cools. The peak in neutron flux may be as late as 2022.

clip_image018

Figure 9: North Dakota December 3, 2019

The economic consequences of a cooling Earth are shown in this figure of part of a satellitephoto of a rural area of North Dakota taken on December 3, 2019. White is snow and the brown rectangles are unharvested corn. In NASA’s words:

“a wet fall, combined with corn plants that contained too much moisture, provoked famers to leave the corn in the fields this year. Snow on corn stocks can clog harvesting equipment. But the bigger concern is the moisture content. It is more economically prudent for a farmer to wait and let the corn dry on the stalks—harvesting it in February or early March—than it is to harvest it now and have to dry it in storage facilities.”


New Sunspot Space Age Record

Reposted from spacewesther.com:

SUNSPOTS BREAK A SPACE AGE RECORD: Solar Minimum is becoming very deep indeed. Over the weekend, the sunset a Space Age record for spotlessness. So far in 2019, the sun has been without sunspots for more than 270 days, including the last 33 days in a row. Since the Space Age began, no other year has had this many blank suns.


Above: The blank sun on Dec. 16, 2019. Credit: NASA/Solar Dynamics Observatory

The previous record-holder was the year 2008, when the sun was blank for 268 days. That was during the epic Solar Minimum of 2008-2009, formerly the deepest of the Space Age. Now 2019 has moved into first place.

Solar Minimum is a normal part of the 11-year sunspot cycle. The past two (2008-2009 and 2018-2019) have been long and deep, making them “century-class” Minima. To find a year with more blank suns, you have to go back to 1913, which had 311 spotless days.

Last week, the NOAA/NASA Solar Cycle Prediction Panel issued a new forecast. Based on a variety of predictive techniques, they believe that the current Solar Minimum will reach its deepest point in April 2020 (+/- 6 months) followed by a new Solar Maximum in July 2025. This means that low sunspot counts and weak solar activity could continue for some time to come.

Spaceweather.com

How the sun affects temperatures on Earth (w/ Valentina Zharkova, Northumbria University)

Conversations That Matter, with Stuart McNish

The sun is going through a stage known as a solar or Maunder Minimum.’This is where the solar activity that ignites solar flares or sun spots has decreased. It’s a normal cycle and one that has been linked to the mini ice age that lasted more than 50 years starting in the mid-1600s.

According to space weather since 2015, the number of days without a recordable sun spot has been rising year over year. NOAA, NASA and others all appear to agree the sun is entering a solar minimum phase.

What it means is open to interpretation because as Professor William Happer pointed out when I asked him about the growing number of people and agencies that suggest a solar minimum could lead to a cooling off period, he directed me the Danish proverb: “It is difficult to make predictions, especially about the future.”

It has been suggested that mathematics can establish patterns and back them up with empirical evidence to support a prediction. We reached out to Professor of Mathematics Valentina Zharkova of Northumbria University, one of the first people to raise awareness of the decrease in solar activity, for a Conversation That Matters about the sun, its reduced activity and her reading of the impact it will have on temperatures on earth.

My bets are with Dr. Zharkova, we will have a Maunder light Grand Minimum in the next 30 years. Your thoughts in the comments.

Deep Solar Minimum on the Verge of a Historic Milestone

Guest post by Paul Dorian

clip_image002Daily observations of the number of sunspots since 1 January 1900 according to Solar Influences Data Analysis Center (SIDC). The thin blue line indicates the daily sunspot number, while the dark blue line indicates the running annual average. The recent low sunspot activity is clearly reflected in the recent low values for the total solar irradiance. Data source: WDC-SILSO, Royal Observatory of Belgium, Brussels. Last day shown: 31 October 2019. Last diagram update: 1 November 2019. [Courtesy climate4you.com]

*Deep solar minimum on the verge of an historic milestone*

Overview

The sun is currently in the midst of a deep solar minimum and it is about to reach an historic milestone. So far this year the sun has been blank (i.e., no visible sunspots) for 266 days and, barring any major surprises, it’ll reach 269 days early next week which will be the quietest year in terms of sunspots since 1913 when the sun was spotless for 311 days. In fact, the current stretch of consecutive spotless days has reached 29 and for the year the sun has been blank 77% of the time. The current record-holder in the satellite era for spotless days in a given year is 2008 when the sun was blank for 268 days making the 2008-2009 solar minimum the deepest since 1913.

Solar minimum is a normal part of the 11-year sunspot cycle, but the last one and the current one have been far deeper than most. One of the consequences of a solar minimum is a reduction of solar storms and another is the intensification of cosmic rays. The just ended solar cycle 24 turned out to be one of the weakest in more than a century – continuing a weakening trend that began in the 1980’s – and, if the latest forecasts are correct, the next solar cycle will be the weakest in more than 200 years.

clip_image004
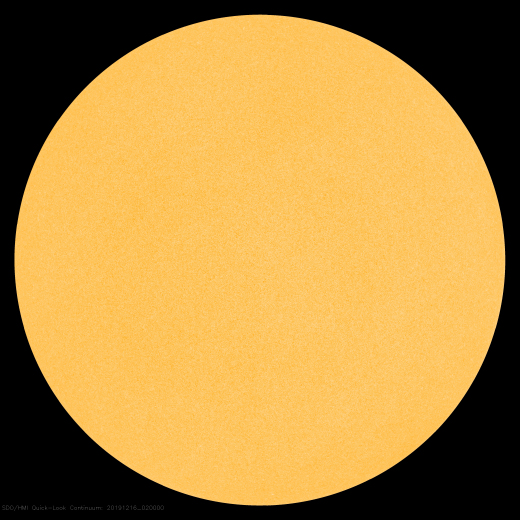
The sun remains spotless today and has been so 77% of the time in 2019; image courtesy NASA SDO/HMI, spaceweather.com

Solar minimum and the intensification of cosmic rays

One of the natural impacts of decreasing solar activity is the weakening of the ambient solar wind and its magnetic field which, in turn, allows more and more cosmic rays to penetrate the solar system. Galactic cosmic rays are high-energy particles originating from outside the solar system that can impact the Earth’s atmosphere. Our first line of defense from cosmic rays comes from the sun as its magnetic field and the solar wind combine to create a ‘shield’ that fends off cosmic rays attempting to enter the solar system. The shielding action of the sun is strongest during solar maximum and weakest during solar minimum with the weakening magnetic field and solar wind.  The intensity of cosmic rays varies globally by about 15% over a solar cycle because of changes in the strength of the solar wind, which carries a weak magnetic field into the heliosphere, partially shielding Earth from low-energy galactic charged particles.

clip_image006Cosmic rays have been intensifying for more than 4 years. On Dec. 5th and 6th they surged within a percentage point of the Space Age record, according to data from neutron counters at the University of Oulu’s Cosmic Ray Station in Finland. Courtesy spaceweather.com.

High-altitude balloons have been launched on a periodic basis in recent years to monitor stratospheric radiation associated with the influx of cosmic rays and they have shown a steady increase since 2015 (campaign sponsored by spaceweather.com). In this set of measurements, cosmic rays have increased by about 13% during the past four years over the central part of California. At another location, the neutron monitor at the University of Oulu’s cosmic ray station in Finland recorded levels earlier this month that were within a percentage point of the satellite era record.

clip_image008Cosmic rays in the stratosphere are intensifying for the 4th year in a row. This finding comes from a campaign of almost weekly high-altitude balloon launches conducted by the students of Earth to Sky Calculus. Since March 2015, there has been a ~13% increase in X-rays and gamma-rays over central California, where the students have launched hundreds of balloons. The grey points in the graph are Earth to Sky balloon data. Overlaid on that time series is a record of neutron monitor data from the Sodankyla Geophysical Observatoryin Oulu, Finland. The correlation between the two data sets is impressive, especially considering their wide geographic separation and differing methodologies. Neutron monitors have long been considered a “gold standard” for monitoring cosmic rays on Earth. This shows that our student-built balloons are gathering data of similar quality.

Cosmic rays are of interest to anyone who flies on airplanes. According to spaceweather.com, the International Commission on Radiological Protection has classified pilots as occupational radiation workers because of cosmic ray doses they receive while flying. A recent study by researchers at the Harvard School of Public Health shows that flight attendants face an elevated risk of cancer compared to members of the general population. They listed cosmic rays as one of several risk factors. There are also some studies that suggest cosmic rays promote the formation of clouds in the atmosphere; if so, increasing cosmic rays could affect weather and climate.

clip_image010400 years of sunspot observations; courtesy Wikipedia

Solar cycle 25

The solar cycle is like a pendulum, swinging back and forth between periods of high and low sunspot number every 11 years or so. Researchers have been tracking solar cycles since they were discovered in the 19th century. The just ended solar cycle, #24, was the weakest with the fewest sunspots since solar cycle 14 peaked in February 1906. Solar cycle 24 continued a recent trend of weakening solar cycles which began with solar cycle 21 that peaked around 1980. The very latest forecast for the next solar cycle (#25) says it will be weaker than the just ended SC24 and perhaps the weakest of the last 200 years. To be fair, some earlier forecasts had the next solar cycle being in similar magnitude to SC24.  However, research now underway has apparently found a more reliable method to predict space weather. The maximum of this next cycle – measured in terms of sunspot numbers, could be 30 to 50% lower than the most recent one – solar cycle 24 according to the latest forecast. The results of this new forecasting technique show that the next solar cycle will start in 2020 and reach its maximum in 2025.

The new forecast is the work of a team led by Irina Kitiashvili of the Bay Area Environmental Research Institute at NASA’s Ames Research Center in Silicon Valley, California. Using data collected since 1976 from the Solar and Heliospheric Observatory and the Solar Dynamics Observatory space missions, the researchers were able to come up with a prediction by directly observing the solar magnetic field rather than simply counting sunspots, which provides only a rough gauge of activity inside the Sun. Because this is a relatively new approach, there is only data from four complete cycles, but by combining three sources of solar observations with estimates of the Sun’s interior activity, the team was able to produce a prediction in 2008 that matched the activity that was observed over the past 11 years.

One challenge for researchers working to predict the Sun’s activities is that scientists do not yet completely understand the inner workings of our star. Some factors that play out deep inside the Sun cannot be measured directly. They have to be estimated from measurements of related phenomena on the solar surface like sunspots, coronal holes and filaments. Kitiashvili’s method differs from other prediction tools in terms of the raw material for its forecast. Previously, researchers used the number of sunspots to represent indirectly the activity of the solar magnetic field. The new approach takes advantage of direct observations of magnetic fields emerging on the surface of the Sun.

clip_image011Temperature recordings at the Greenland Ranch weather station in Death Valley, California during the intense heat wave of July 1913. This excerpt about the record-breaking heat wave comes from an article posted during January 1922 in the meteorological journal Monthly Weather Review which is still in publication today. Courtesy NOAA

Extreme weather of 1913

One final note of interest, the year 1913 cited earlier for its lack of sunspots on the order of 311 days was a year filled with wild weather extremes including the hottest temperature ever recorded on Earth in Death Valley, CA. For more on the extreme weather of 1913 click here.

Meteorologist Paul Dorian
Perspecta, Inc.
perspectaweather.com

Cosmic Ray Update

Dec. 13, 2019: Something ironic is happening in Earth’s atmosphere. Solar activity is low–very low. Yet atmospheric radiation is heading in the opposite direction. Cosmic rays percolating through the air around us are at a 5 year high.

Take a look at these data gathered by cosmic ray balloons launched by Spaceweather.com and the students of Earth to Sky Calculus almost weekly since March 2015:

e2s2

Radiation levels have been increasing almost non-stop since the monitoring program began, with recent flights registering the highest levels of all.

What’s happening? The answer is “Solar Minimum”–the low point of the 11-year solar cycle. During Solar Minimum (underway now) the sun’s magnetic field weakens and allows energetic particles from deep space to penetrate the Solar System. As solar activity goes down, cosmic rays go up; yin-yang.

When cosmic rays hit the top of Earth’s atmosphere, they produce a spray of secondary particles and photons that rain down on Earth’s surface. This is what our balloons measure–the secondary spray. We use X-ray and gamma-ray detectors sensitive to energies in the range 10 keV to 20 MeV. This type of radiation, which you can also find in medical X-ray machines and airport security scanners, has increased more than 20% in the stratosphere.

crinfo2

Another way to measure cosmic rays is using a neutron monitor. Neutrons are an important type of secondary cosmic ray. They reach Earth’s surface with relative ease and are biologically effective. Neutron monitors at the Sodankyla Geophysical Observatory in Oulu, Finland, are getting results similar to ours. Oulu data show that cosmic rays have been increasing for the past 5 years and, moreover, are within percentage points of the Space Age record.

The Space Age record for cosmic rays isn’t very old. It was was set in late 2009-early 2010 near the end of a very deep Solar Minimum much like the one we’re experiencing now. As 2019 comes to a close, neutron counts at Oulu are approaching those same levels. Indeed, a new record could be just weeks or months away.

Who cares? Anyone who steps on an airplane. Cosmic rays penetrate commercial jets, delivering whole-body dosages equal to one or more dental X-rays even on regular flights across the USA. Cosmic rays pose an even greater hazard to astronauts, of course. Cosmic rays can also alter the electro-chemistry of Earth’s upper atmosphere and are thought to play some role in sparking lightning.

Stay tuned for updates.