Cosmic Ray Update

Dec. 13, 2019: Something ironic is happening in Earth’s atmosphere. Solar activity is low–very low. Yet atmospheric radiation is heading in the opposite direction. Cosmic rays percolating through the air around us are at a 5 year high.

Take a look at these data gathered by cosmic ray balloons launched by Spaceweather.com and the students of Earth to Sky Calculus almost weekly since March 2015:

e2s2

Radiation levels have been increasing almost non-stop since the monitoring program began, with recent flights registering the highest levels of all.

What’s happening? The answer is “Solar Minimum”–the low point of the 11-year solar cycle. During Solar Minimum (underway now) the sun’s magnetic field weakens and allows energetic particles from deep space to penetrate the Solar System. As solar activity goes down, cosmic rays go up; yin-yang.

When cosmic rays hit the top of Earth’s atmosphere, they produce a spray of secondary particles and photons that rain down on Earth’s surface. This is what our balloons measure–the secondary spray. We use X-ray and gamma-ray detectors sensitive to energies in the range 10 keV to 20 MeV. This type of radiation, which you can also find in medical X-ray machines and airport security scanners, has increased more than 20% in the stratosphere.

crinfo2

Another way to measure cosmic rays is using a neutron monitor. Neutrons are an important type of secondary cosmic ray. They reach Earth’s surface with relative ease and are biologically effective. Neutron monitors at the Sodankyla Geophysical Observatory in Oulu, Finland, are getting results similar to ours. Oulu data show that cosmic rays have been increasing for the past 5 years and, moreover, are within percentage points of the Space Age record.

The Space Age record for cosmic rays isn’t very old. It was was set in late 2009-early 2010 near the end of a very deep Solar Minimum much like the one we’re experiencing now. As 2019 comes to a close, neutron counts at Oulu are approaching those same levels. Indeed, a new record could be just weeks or months away.

Who cares? Anyone who steps on an airplane. Cosmic rays penetrate commercial jets, delivering whole-body dosages equal to one or more dental X-rays even on regular flights across the USA. Cosmic rays pose an even greater hazard to astronauts, of course. Cosmic rays can also alter the electro-chemistry of Earth’s upper atmosphere and are thought to play some role in sparking lightning.

Stay tuned for updates.

Some Serious Space Weather at Play.

View at Medium.com

Popular Science has the details:

That Time a Bunch of Underwater Mines Exploded and the Sun Was the Only Suspect

Explosives going off without warning is bad news for… well, for everybody. So imagine the U.S. military’s alarm when, on August 4, 1972, it witnessed about two dozen or so spontaneous explosions in the waters off Hon La in North Vietnam. America’s Operation Pocket Money had dropped underwater mines there many weeks before to deter trade ships from venturing to North Vietnam ports. But the mines were only supposed to detonate when ships were around, and Americans surveilling the water from overhead were only seeing clear blue when the bombs went off.

Initially, the explosions were inexplicable. What could have possibly set the mines off? Big marine animals? Equipment malfunctions? Were the North Vietnamese using a secret strategy to blow up the mines remotely?

Over four-and-a-half decades later, we now know the culprit was the sun. According to findings recently published in the journal Space Weather, a powerful solar storm likely triggered the mines’ magnetic sensors and caused them to explode.

“It was a storm of magnificent proportions,” says Delores Knipp, a space weather researcher at the University of Colorado, Boulder and the lead author of the new paper. “It was a big story back in the day, and continues to be a big story.” The storm occurred in between Apollo missions 16 and 17, but it’s generally accepted that the radiation dose would have incapacitated (if not outright killed) astronauts traveling to and from the moon. In addition, other studies on the solar storm found the resulting geomagnetic current created many different power fluctuations in North America. “It’s been a storm that has been known for different effects in different communities.”

Continue reading HERE.

The article concludes:

But Knipp says a general estimation, based on current knowledge, is that these sorts of solar storms hit Earth about once every 70 years — “often enough that we need to be thinking about what types of technologies are subject to harm in these kinds of environments.” The question isn’t really if a storm powerful enough to knock out the power grid and wreck our technological equipment will hit us — but when it will happen, and whether we’ll be ready in time to prepare and safeguard our infrastructure.

I follow space weather on YouTube daily on the Suspicious Observer channel and weekly on space physicist Tamitha Skov’s channel. We should all pay close attention to our unstable star.

View at Medium.com

Quiet sun sets new record for spotless days – Evidence of SC-25

Reblogged from Watts Up With That


As of November 1st, the current stretch of days without any observable sunspots in solar cycle 24 has reached a total of 228 spotless days in 2019 so far That’s 75% of the year so far. During the 2008 solar minimum, there were 268 days without sunspots, or 73% of the year.

The sun as seen by the Solar Dynamics Observatory on Oct 31 2019

Here’s a tally of spotless days for the last solar cycle:

2019 total: 228 days (75%)
2018 total: 221 days (61%)
2017 total: 104 days (28%)
2016 total: 32 days (9%)
2015 total: 0 days (0%)
2014 total: 1 day (<1%)
2013 total: 0 days (0%)
2012 total: 0 days (0%)
2011 total: 2 days (<1%)
2010 total: 51 days (14%)
2009 total: 260 days (71%)
2008 total: 268 days (73%)
2007 total: 152 days (42%)
2006 total: 70 days (19%)

Meanwhile, a new cycle 25 sunspot was observed today. From Spaceweather.com :

Breaking a string of 28 spotless days, a new sunspot is emerging in the sun’s southern hemisphere–and it’s a member of the next solar cycle. A picture of the sunspot is inset in this magnetic map of the sun’s surface from NASA’s Solar Dynamics Observatory:

How do we know this sunspot belongs to the next solar cycle? Its magnetic polarity tells us so. Southern sunspots from old Solar Cycle 24 have a -/+ polarity. This sunspot is the opposite: +/-. According to Hale’s Law, sunspots switch polarities from one solar cycle to the next. Today’s emerging sunspot is therefore a member of Solar Cycle 25.

This development does not mean Solar Minimum is finished. On the contrary, low solar activity will probably continue for at least another year as Solar Cycle 24 decays and Solar Cycle 25 slowly sputters to life. If forecasters are correct, Solar Cycle 25 sunspots will eventually dominate the solar disk, bringing a new Solar Maximum as early as 2023.


Back in April 2019, an confab of solar scientists said:

Experts Predict a Long, Deep Solar Minimum

“We expect Solar Cycle 25 will be very similar to Cycle 24: another fairly weak maximum, preceded by a long, deep minimum,” says panel co-chair Lisa Upton, a solar physicist with Space Systems Research Corp.

solar-forecast

Potential role of low solar activity this winter as solar minimum deepens and the wide-ranging impacts of increasing cosmic rays

Reblogged from Watts Up With That

Guest post by Paul Dorian

*Potential role of low solar activity this winter as solar minimum deepens and the wide-ranging impacts of increasing cosmic rays*

clip_image002

The sun is blank again today and for the 200th day in 2019 as the solar minimum deepens; image courtesy NASA

Overview
The sun continues to be very quiet and it has been without sunspots on 200 days during 2019 or 72% of the time which is the highest percentage since 2009. We have entered into a solar minimum phase of the solar cycle and sunspot counts suggest this could turn out to be the deepest of the past century. Low solar activity has been well correlated with an atmospheric phenomenon known as “high-latitude blocking” and this could play an important role in the upcoming winter season; especially, across the eastern US. In addition, one of the natural impacts of decreasing solar activity is the weakening of the ambient solar wind and its magnetic field which, in turn, allows more cosmic rays to penetrate the solar system. The intensification of cosmic rays can have important consequences on such things as Earth’s cloud cover and climate, the safety of air travelers, and as a possible trigger mechanism for lightning.

clip_image004

Daily observations of the number of sunspots since 1 January 1900 according to Solar Influences Data Analysis Center (SIDC). The thin blue line indicates the daily sunspot number, while the dark blue line indicates the running annual average. The recent low sunspot activity is clearly reflected in the recent low values for the total solar irradiance. Data source: WDC-SILSO, Royal Observatory of Belgium, Brussels. Last day shown: 30 September 2019. Plot courtesy “climate4you.com”.

Background

Solar cycle 24 was the weakest sunspot cycle with the fewest sunspots since cycle 14 peaked in February 1906. Solar cycle 24 continued a recent trend of weakening solar cycles which began with solar cycle 21 that peaked around 1980. The sun is blank again today for the 200th day this year and the last time the sun was this spotless in a given year on a percentage basis was 2009 during the last solar minimum when 71% of the days were without visible sunspots.  That last solar minimum actually reached a nadir in 2008 when an astounding 73% of the year featured a spotless sun – the most spotless days in a given year since 1913 – and this year has a chance to match or exceed that quietest of years in more than a century.

clip_image006

Low solar activity years are well correlated with abnormally high geopotential height anomalies at 500 millibars over high-latitude regions such as Greenland and Iceland (shown in red, orange, yellow); data courtesy NOAA/NCAR

Low solar activity and “high-latitude blocking”

As any snow lover and weather enthusiast knows living in the I-95 corridor, it takes many ingredients to fall into place for a snowstorm to actually take place; especially, in the urban areas of DC, Philly, New York City and Boston. One requirement for accumulating snow is, of course, cold air near or below freezing, but it can be a little more complicated than that. It is one thing to have cold air around at the beginning of a potential storm, but the best chance for significant snow comes when there is sustained cold air; otherwise, you could end up with a snow-changing-to-rain type of event; especially, in the big cities and areas closer to the coast. One of the ways to sustain a cold air mass in the Mid-Atlantic/NE US is to have “high-latitude blocking” and that type of weather phenomenon is well correlated with low solar activity.

“High-latitude blocking” during the winter season is characterized by persistent high pressure in northern latitude areas such as Greenland, northeastern Canada, and Iceland. If you look back at years with low solar activity, the upper-level geopotential height anomaly pattern is dominated by high pressure over these high-latitude regions during the winter season (December-to-February). Without this type of blocking pattern in the upper atmosphere, it is more difficult to get sustained cold air masses in the eastern US during the winter season.

In addition to the increased chance of sustained cold air during low solar activity years, “high-latitude blocking” in the upper atmosphere tends to slow down the movement and departure of storms along the Mid-Atlantic/NE US coastlines and this too increases the chances for significant snowfall as long as there is entrenched cold air. In fact, some of the greatest snowstorms in the Mid-Atlantic/NE US regions took place in low solar activity winters including, for example, those in February 2010, December 2009, and January 1996. There are, of course, other important factors in addition to solar activity to consider in the prediction of accumulating snow along the I-95 corridor including sea surface temperatures in the western Atlantic and the positioning of polar and sub-tropical jet streaks. The 2019-2020 “Winter Outlook” by Perspecta Weather will be released shortly and low solar activity will certainly be one key factor among several.

clip_image008

Data source: The Sodankyla Geophysical Observatory in Oulu, Finland. Plot courtesy Spaceweather.com

Low solar activity and cosmic rays
Galactic cosmic rays are high-energy particles originating from outside the solar system that can impact the Earth’s atmosphere. Our first line of defense from cosmic rays comes from the sun as its magnetic field and the solar wind combine to create a ‘shield’ that fends off cosmic rays attempting to enter the solar system. The shielding action of the sun is strongest during Solar Maximum and weakest during Solar Minimum with the weakening magnetic field and solar wind.  The intensity of cosmic rays varies naturally during the typical 11-year solar cycle with about a 15% variation because of the changes in the strength of the solar wind.

Evidence of an increase in stratospheric radiation
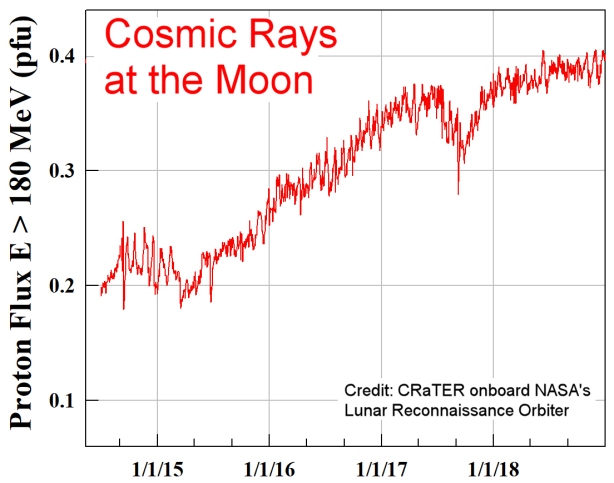
One way to monitor cosmic ray penetration into the Earth’s upper atmosphere is to measure stratospheric radiation over an extended period of time.  “Spaceweather.com” has led an effort for nearly four years to monitor radiation levels in the stratosphere over California with frequent high-altitude helium balloon flights.  These balloons contain sensors which detect X-rays and gamma-rays in the energy range 10 keV to 20 MeV and are produced by the crash of primary cosmic rays into Earth’s atmosphere. These energies span the range of medical X-ray machines and airport security scanners.  The findings confirm the notion that indeed cosmic rays have been steadily increasing over California as we climb into the solar minimum.

During the last solar minimum in 2009, radiation peppering Earth from deep space reached a 50-year high at levels never before seen during the satellite era – and we’re getting very close to those same levels and a new record is certainly on the table in the near future. Ground-based neutron monitors and high-altitude cosmic ray balloons are registering the increase in cosmic rays. Neutron monitors at the Sodankyla Geophysical Observatory in Oulu, Finland show that cosmic rays are just percentages away from a new record in the satellite era which was set in 2009. Data has been measured at this observatory in Finland since 1964. When cosmic rays hit Earth’s atmosphere, they produce a spray of secondary particles that rain down on Earth’s surface. Among these particles are neutrons and the detectors at the observatory in Oulu count them as a proxy for cosmic rays.

Consequences of increasing cosmic rays

1) Cloud cover/climate
The correlation between cosmic rays and cloud cover over a solar cycle was first reported by Svensmark and Friis-Christensen in 1997. A more recent study by Svensmark published in the August 2016 issue of Journal of Geophysical Research: Space Physics continues to support the idea of an important connection between cosmic rays and clouds.

In this publication, the authors found that “the observed variation of 3–4% of the global cloud cover during the recent solar cycle is strongly correlated with the cosmic ray flux. This, in turn, is inversely correlated with the solar activity. The effect is larger at higher latitudes in agreement with the shielding effect of the Earth’s magnetic field on high-energy charged particles. The above relation between cosmic ray flux and cloud cover should also be of importance in an explanation of the correlation between solar cycle length and global temperature that has been found”.

2) Threat to air travelers
Not only can an increase of cosmic rays have an impact on Earth’s cloud cover and climate, it is of special interest to air travelers.  Cosmic radiation at aviation altitudes is typically 50 times that of natural sources at sea level. Cosmic rays cause “air showers” of secondary particles when they hit Earth’s atmosphere. Indeed, this is what neutron monitors and cosmic ray balloons are measuring–the secondary spray of cosmic rays that rains down on Earth. Secondary cosmic rays penetrate the hulls of commercial aircraft, dosing passengers with the whole body equivalent of a dental X-ray even on ordinary mid-latitude flights across the USA. International travelers receive even greater doses (source). The International Commission on Radiological Protection has classified pilots as occupational radiation workers because of accumulated cosmic ray doses they receive while flying. Moreover, a recent study by researchers at the Harvard School of Public Health shows that flight attendants face an elevated risk of cancer compared to members of the general population. They listed cosmic rays as one of several risk factors.

3) Possible lightning trigger
Finally, there has been some research suggesting there is a connection between cosmic rays and lightning (paper 1paper 2).  When cosmic rays smash into molecules in our atmosphere, the collisions create showers of subatomic particles, including electrons, positrons, and other electrically charged particles. This shower of electrons would collide into still more air molecules, generating more electrons. All in all, cosmic rays could each set off an avalanche of electrons and trigger lightning.

clip_image010

Circled areas on plot indicate locations that experienced the northern lights during the Carrington Event of 1859.

Final Thoughts
While the frequency of solar storm activity generally lessens during periods of low solar activity (e.g., during solar minimum phases), there is actually some evidence that suggests the severity does not diminish.  In fact, the most famous solar storm of all now known as The Carrington Event took place in 1859 during an overall weak solar cycle (#10).  In addition, other solar activity, such as coronal holes that unleash streams of solar material out into space, can amplify the auroras at Earth’s poles.  The bottom line, a lack of sunspots does not mean the sun’s activity stops altogether and it needs to be constantly monitored – even during periods of a blank sun.

Meteorologist Paul Dorian
Perspecta, Inc.
perspectaweather.com

1921 Solar Event May Have Been Bigger than Carrington Event

Details at ARRL Newsletter.

Scientific American reports that, according to new data, the “New York Railroad Storm” of 1921 may have surpassed the intensity of the famous Carrington Event of 1859. In his paper published in the journal Space Weather, Jeffrey Love of the US Geological Survey and his colleagues reexamined the intensity of the 1921 event in greater detail than previously.

Although different measures of intensity exist, geomagnetic storms are often rated on an index called disturbance storm time (Dst) — a way of gauging global magnetic activity by averaging out values for the strength of Earth’s magnetic field measured at multiple locations. Earth’s baseline Dst level is about -20 nanoteslas (nT), with a “superstorm” condition occurring when levels fall below -250 nT. Studies of the very limited magnetic data from the Carrington Event peg its intensity at anywhere from -850 to -1,050 nT. According to Love’s study, the 1921 storm came in at about -907 nT.

Peter Ward in his 2017 New York History Blog article “Strange Phenomena: The New York Railroad Storm” recounted that theatre-goers in New York City “marveled at the spectacle” of an iridescent cloud that was brighter than the moon. “On the roof of the Times Building, reporters, having discovered the telegraph lines to be curiously blocked, gathered to watch the aerial kaleidoscope,” he wrote.

As with the earlier Carrington Event, telegraph operators experienced wild fluctuations in the current on their circuits, while wireless propagation was enhanced. “The next day, papers reported that the Central New England railroad station (also home to the telegraph switchboard) had burned to the ground.” Railroad officials later blamed the fire on the aurora.

According to Ward’s article, the lights were visible in New York, California, and Nevada. Especially in rural areas, “the lights were said to be brighter, appear closer to the ground, and even move with a swishing sound.”

Railroad and telegraph service were restored the following week, although one Western Union transatlantic cable showed signs of damage. “Delays and damage lead to some referring to it as the New York Railroad Storm,” Ward wrote.

A dramatic description of the event on the SolarStorms.org website said, “At 7:04 AM on May 15, the entire signal and switching system of the New York Central Railroad below 125th Street was put out of operation, followed by a fire in the control tower at 57th Street and Park Avenue.”

The short article said a telegraph operator reported being driven away from his station by flames that enveloped his switchboard and set the building on fire. “In Sweden a telephone station was reported to have been ‘burned out,’ and the storm interfered with telephone, telegraph, and cable traffic over most of Europe,” the article said.

‘Polar Coaster’ Winter Forecast May Be Related to the ‘Terminator’

An NCAR scientist said a terminator starts the next sunspot cycle, which may impact the weather on the earth.

BOULDER, Colo — Scientists at the National Center for Atmospheric Research (NCAR) are watching the sun for something they call the “Terminator.”

[ More on the Terminator HERE]

It’s an event that signals the end of a solar cycle (in this case, 24) and the start of the next (25).

“We’ll actually see the progression of this terminator event as it ripples around the circumference of the sun,” said Scott McIntosh, director of NCAR’s High Altitude Observatory.

McIntosh said the sun is currently at the bottom of its roughly 11-year-long energy cycle, a point called solar minimum. He expects it to switch back into an active phase sometime in the next 9 months, kicking off the next solar cycle. He said the exact moment of transition may be visible in a signal called a terminator.

“The terminator event is really the signature, the flipping of the switch,” said McIntosh.

He said it takes the terminator about 27 days to complete, which is one rotation of the sun. After that, Solar Cycle 25 will begin.

“Normally it’s only something that can be hind-cast. We don’t know that we’ve hit rock bottom until you’re 12 to 13 months passed it because of the diagnostics that they use,” said McIntosh.

[ . . .]

“Years in which sunspot production are very low typically produce very erratic weather,” said McIntosh.

McIntosh said erratic refers mainly to ocean oscillations and jet stream behavior. That could be applicable to more unpredictable weather with extremely warm and dry periods, followed closely by extreme cold and wet periods.

The famous Farmer’s Almanac winter forecast is one of the few that uses solar activity in their equation. In this year’s edition — the eye-catching headline, “Ride the Polar Coaster” could be in reference to the same erratic weather that McIntosh has seen in his sunspot research.

“The data kind of backs it up,” said McIntosh. “The question is, ‘How the hell does it work?’ That for us especially here at NCAR, that’s the question.”

Read the full article HERE, as it includes Twitter Posts and Graphics.

Can the Sun Produce More Powerful Storms on Earth? (Update 09-04-19)

In a comment on this post, the “Atmosphere Guy” brought up an interesting idea. His thought was that increases in solar Kp (fluctuations in the solar magnetic field )  and the resulting flow of high energy particles can accelerate the development of jet-streams, hurricanes, and cyclones on the earth. 

With the formation of hurricane Dorian in the Atlantic, I have been tracking the Kp and A index and the growth of Dorian.

Screen Shot 2019-09-04 at 12.35.04 PM

Track map of Dorian shows the location and intensity of the storm at 6-hour intervals. The color represents the storm’s maximum sustained wind speeds as classified in the Saffir-Simpson scale. 

Update 01-04-19

Here is the Kp index in 3-hour intervals:

Screen Shot 2019-09-04 at 12.38.39 PM
Kp Index at 3-hour intervals starting 29 August 2019
Screen Shot 2019-09-04 at 12.51.45 PM
An A Index Summary of the Kp Index

Update 09-04-19

Screen Shot 2019-09-04 at 11.26.36 AM


Do you think there is a connection between the growth of Dorian’s power and the Sun’s magnetic field activity?  How?

The Sun’s Weather Cycle May Start in ‘Tsunamis,’ End with ‘Terminators’

By Passant Rabie ar Science & Astronomy 

A tsunami of plasma rushes through the sun before a new sunspot cycle begins

Vw4PsTjP4g3DcMtyY5Tm87-1024-80

An image of the sun in ultraviolet light showing a string of active regions near the Sun’s equator over about 36 hours. (Image: © NASA)

Astronomers may have finally figured out what causes the sun’s 11-year cycle of activity, and it involves a “tsunami” of magnetic fields. 

The sun, like other stars, goes through a cycle marked by a change in magnetic activity, levels of radiation, and the number and size of sunspots. While our sun’s 11-year cycle was discovered more than a century ago, predicting exactly when one cycle ends and a new one begins has been an ongoing challenge. 

A pair of related studies have mapped out the sun’s activity over the course of 140 years, looking for clues about the solar cycle that are visible on the surface. By looking at the way bright flashes of ultraviolet light migrate across the sun’s surface, the researchers discovered that the sun’s mysterious 11-year cycle may be marked by a “terminator” event that ends one cycle and a “tsunami” of magnetic fields that initiates a new one. Those bright flickers of ultraviolet light and the sun’s magnetic fields appear to drive the cycle itself, and monitoring those flashes could help scientists predict when a new cycle will begin.

Continue reading HERE to see the interactive graphics.

Cosmic Ray Update: New Results from the Moon

By Dr Tony Phillips

July 16, 2019: Note to astronauts: 2019 is not a good year to fly into deep space. In fact, it’s shaping up to be one of the worst of the Space Age.

The reason is, the solar cycle. One of the deepest Solar Minima of the past century is underway now. As the sun’s magnetic field weakens, cosmic rays from deep space are flooding into the solar system, posing potential health risks to astronauts.

NASA is monitoring the situation with a radiation sensor in lunar orbit. The Cosmic Ray Telescope for the Effects of Radiation (CRaTER) has been circling the Moon on NASA’s Lunar Reconnaissance Orbiter spacecraft since 2009. Researchers have just published a paper in the journal Space Weather describing CRaTER’s latest findings.

lro

“The overall decrease in solar activity in this period has led to an increased flux of energetic particles, to levels that are approaching those observed during the previous solar minimum in 2009/2010, which was the deepest minimum of the Space Age,” write the authors, led by Cary Zeitlin of NASA’s Johnson Space Flight Center. “The data have implications for human exploration of deep space.”

This always happens during Solar Minimum. As solar activity goes down, cosmic rays go up. The last two Solar Minima have been unusually deep, leading to high cosmic ray fluxes in 2008-2010 and again in 2018-2019. These are the worst years since humans first left Earth in the 1960s.

“It’s a bit counterintuitive,” says one of the authors, Nathan Schwadron, a space physicist at the University of New Hampshire. “Solar Minimum may actually be more dangerous than Solar Maximum.”

In their paper, Zeitlin, Schwadron and co-authors describe an interesting experiment by NASA that highlights the relative peril of solar flares vs. cosmic rays. In 2011, NASA launched the Curiosity rover to Mars. Inside its spacecraft, the rover was protected by about as much shielding (20 gm/cm^2) as a human astronaut would have. A radiation sensor tucked inside kept track of Curiosity’s exposure.

The results were surprising. During the 9-month journey to Mars, radiation from solar flares (including the strongest flare of the previous solar cycle) accounted for only about 5% of Curiosity’s total dose. The remaining 95% came from cosmic rays.

Why the imbalance? “Solar flares of the size we’ve seen during the Space Age can be largely mitigated by achievable depths of spacecraft shielding(1),” explains Zeitlin. “We can’t stop the highest energy cosmic rays, however. They penetrate the walls of any spacecraft.”

Proton_F180_red-1_crop

Solar flares are still a concern. If an astronaut were caught outside on EVA during an intense, unexpected flare, acute effects could include vomiting, fatigue, and low blood counts. A quick return to Earth might be required for medical care. Cosmic rays are more insidious, acting slowly, with maladies such as cancer or heart disease showing up years after the exposure.

As 2019 unfolds, Solar Minimum appears to still be deepening. Cosmic rays haven’t quite broken the Space Age record set in 2009-2010, but they’re getting close, only percentage points from the highest values CRaTER has ever recorded.

“No one can predict what will happen next,” says Schwadron. “However, the situation speaks for itself: We are experiencing a period of unusually weak solar cycles. We have to be prepared for strong cosmic rays.”

END NOTES:

(1) According to Zeitlin, “achievable” shielding depths will be at least 20 to 30 gm/cm^2. “Vehicles carrying humans into deep space will likely have storm shelters that will provide this much shielding or more, and that would indeed be sufficient – even for an event like the great solar flare of August 1972 during the Apollo program – to keep the accumulated dose below the 30-day limit.”

REFERENCE:

“Update on Galactic Cosmic Ray Integral Flux Measurements in Lunar Orbit With CRaTER”, by C. Zeitlin, N. A. Schwadron, H. E. Spence, A. P. Jordan, M. D. Looper, J. Wilson, J. E. Mazur, L. W. Townsend. https://agupubs.onlinelibrary.wiley.com/doi/10.1029/2019SW002223

Link to the original post is HERE


The Next Grand Solar Minimum is Approaching

Oscillations of the baseline of solar magnetic field and solar irradiance on a millennial timescale

Another paper by V. V. Zharkova, S. J. Shepherd, S. I. Zharkov & E. Popova 

Abstract

Recently discovered long-term oscillations of the solar background magnetic field associated with double dynamo waves generated in inner and outer layers of the Sun indicate that the solar activity is heading in the next three decades (2019–2055) to a Modern grand minimum similar to Maunder one. On the other hand, a reconstruction of solar total irradiance suggests that since the Maunder minimum there is an increase in the cycle-averaged total solar irradiance (TSI) by a value of about 1–1.5 Wm−2 closely correlated with an increase of the baseline (average) terrestrial temperature. In order to understand these two opposite trends, we calculated the double dynamo summary curve of magnetic field variations backward one hundred thousand years allowing us to confirm strong oscillations of solar activity in regular (11 year) and recently reported grand (350–400 year) solar cycles caused by actions of the double solar dynamo. In addition, oscillations of the baseline (zero-line) of magnetic field with a period of 1950 ± 95 years (a super-grand cycle) are discovered by applying a running averaging filter to suppress large-scale oscillations of 11 year cycles. Latest minimum of the baseline oscillations is found to coincide with the grand solar minimum (the Maunder minimum) occurred before the current super-grand cycle start. Since then the baseline magnitude became slowly increasing towards its maximum at 2600 to be followed by its decrease and minimum at ~3700. These oscillations of the baseline solar magnetic field are found associated with a long-term solar inertial motion about the barycenter of the solar system and closely linked to an increase of solar irradiance and terrestrial temperature in the past two centuries. This trend is anticipated to continue in the next six centuries that can lead to a further natural increase of the terrestrial temperature by more than 2.5 °C by 2600.

Conclusions

Until recently, solar activity was accepted to be one of the important factors defining the temperature on Earth and other planets. In this paper we reproduced the summary curve of the solar magnetic field associated with solar activity5,6 for the one hundred thousand years backward by using the formulas describing the sum of the two principal components found from the full disk solar magnetograms. In the past 3000 years the summary curve shows the solar activity for every 11 years and occurrence of 9 grand solar cycles of 350–400 years, which are caused by the beating effects of two magnetic waves generated by solar dynamo at the inner and outer layers inside the solar interior with close but not equal frequencies6.

The resulting summary curve reveals a remarkable resemblance to the sunspot and terrestrial activity reported in the past millennia including the significant grand solar minima: Maunder Minimum (1645–1715), Wolf minimum (1200), Oort minimum (1010–1050), Homer minimum (800–900 BC) combined with the grand solar maxima: the medieval warm period (900–1200), the Roman warm period (400–10BC) etc. It also predicts the upcoming grand solar minimum, similar to Maunder Minimum, which starts in 2020 and will last until 2055.

A reconstruction of solar total irradiance suggests that there is an increase in the cycle-averaged total solar irradiance (TSI) since the Maunder minimum by a value of about 1–1.5 Wm−2 27. This increase is closely correlated with the similar increase of the average terrestrial temperature26,43. Moreover, from the summary curve for the past 100 thousand years we found the similar oscillations of the baseline of magnetic field with a period of 1950 ± 95 years (a super-grand solar cycle) by filtering out the large-scale oscillations in 11 year cycles. The last minimum of a super-grand cycle occurred at the beginning of Maunder minimum. Currently, the baseline magnetic field (and solar irradiance) are increasing to reach its maximum at 2600, after which the baseline magnetic field become decreasing for another 1000 years.

The oscillations of the baseline of solar magnetic field are likely to be caused by the solar inertial motion about the barycentre of the solar system caused by large planets. This, in turn, is closely linked to an increase of solar irradiance caused by the positions of the Sun either closer to aphelion and autumn equinox or perihelion and spring equinox. Therefore, the oscillations of the baseline define the global trend of solar magnetic field and solar irradiance over a period of about 2100 years. In the current millennium since Maunder minimum we have the increase of the baseline magnetic field and solar irradiance for another 580 years. This increase leads to the terrestrial temperature increase as noted by Akasofu26 during the past two hundred years. Based on the growth rate of 0.5 C per 100 years26 for the terrestrial temperature since Maunder minimum, one can anticipate that the increase of the solar baseline magnetic field expected to occure up to 2600 because of SIM will lead, in turn, to the increase of the terrestrial baseline temperature since MM by 1.3 °C (in 2100) and, at least, by 2.5–3.0 °C (in 2600).

Naturally, on top of this increase of the baseline terrestrial temperature, there are imposed much larger temperature oscillations caused by standard solar activity cycles of 11 and 350–400 years and terrestrial causes. The terrestrial temperature is expected to grow during maxima of 11 year solar cycles and to decrease during their minima. Furthermore, the substantial temperature decreases are expected during the two grand minima47 to occur in 2020–2055 and 2370–24156, whose magnitudes cannot be yet predicted and need further investigation. These oscillations of the estimated terrestrial temperature do not include any human-induced factors, which were outside the scope of the current paper.

Continue reading HERE

Keep your warm coat handy the climate is about to get interesting.