Solar Climate Change Could Cause Colder Climate on Earth

Russ Steele

The main story is at the Space Daily and it about the impact of solar changes on communications satellites, spacecraft, and high altitude flyers. However, this latest research on reduced solar activity could have a major impact our climate. First the research and then the climate impact.

Recent research shows that the space age has coincided with a period of unusually high solar activity, called a grand maximum. Isotopes in ice sheets and tree rings tell us that this grand solar maximum is one of 24 during the last 9,300 years and suggest the high levels of solar magnetic field seen over the space age will reduce in future.

Graduate student Luke Barnard of the University of Reading will present new results on ‘solar climate change’ in his paper at the National Astronomy Meeting in Manchester.

The level of radiation in the space environment is of great interest to scientists and engineers as it poses various threats to man-made systems including damage to electronics on satellites. It can also be a health hazard to astronauts and to a lesser extent the crew of high-altitude aircraft.

The main sources of radiation are galactic cosmic rays (GCRs), which are a continuous flow of highly energetic particles from outside our solar system and solar energetic particles (SEPs), which are accelerated to high energies in short bursts by explosive events on the Sun.

The amount of radiation in the near-Earth environment from these two sources is partly controlled in a complicated way by the strength of the Sun’s magnetic field.

There are theoretical predictions supported by observational evidence that a decline in the average strength of the Sun’s magnetic field would lead to an increase in the amount of GCRs reaching near-Earth space.

ooo

By comparing this grand maximum with 24 previous examples, Mr. Barnard predicts that there is an 8% chance that solar activity will fall to the very low levels seen in the so-called ‘Maunder minimum’, a period during the seventeenth century when very few sunspots were seen.

Livingston and Penn have been observing the strength of the magnetic fields on the sun, especially around sunspots and have predicted that by Cycle 25 the sunspots will vanish, resulting in another grand minimum.

According to Henrik Svensmark’s cosmic theory of climate change, which was validated in experiments in 2006 and then reconfirmed in 2011 in the CLOUD experiment at CERN, cosmic rays coming from old supernovas can indeed make molecular clusters that can grow nearly a million times in mass to be large enough to become “cloud condensation nuclei” on which water droplets can form. Just a 10% increase in cloud cover from significantly reduce the earths temperature, and could bringing on a little ice age.

Readers can learn more about cosmic rays and climate change in The Chilling Stars: A New Theory of Climate Change by Nigel Calder and Henrik Svensmark.

If Luke Barnard’s solar climate change research is correct, a quiet sun will allow more cosmic ray reach the earth. And, if Henrik Svensmark is correct then these cosmic rays will produce more clouds , and we can expect a much cooler world.

The question is will be have another little ice age?  You thoughts are most welcome in the comments.

Maunder Minimum and Fall of Ming Dynasty

Russ Steele

Doing some research for another project, I came across this bit of China history during the Maunder Minimum.

A Prolonged drought in Norther China during the Maunder Minimum is credited with the fall of the Ming Dynasty.

In June 1644 the great Ming Empire that had ruled China since 1368 came to an end when Manchu tribesmen from the north took Beijing and founded the Qing rule.

“There is no easy way to explain how the Manchus with a population of about one million, could by 1644 seize the throne of China”

Huang,R., China: A Macro-History M.E. Sharpe, Inc., Armonk, New York (1988)

However there was a climatic explanation for this event according to Sultan Hameed, Institute for Terrestrial and Planetary Atmospheres, at Stony Brook University and Gaofa Gong at the Institute for Geography, Chinese Academy of Sciences, Beijing

  • Northern China experienced droughts lasting15 years (1628-43) prior to the dynasty change.
  • The resulting famines led to an extensive breakdown of social order and a large number of peasant rebellions.

The Authors cite the following from  Van Loon, Meehl & Arblaster (2004)

  • There is deficiency of precipitation in North China with low solar activity is consistent with the results an extended drought.
  • Their explanation is that the Hadley circulation weakens with decreasing solar activity and vice versa.
  • There may be a temperature related effect also. The annual average temperature in China was about 1oC colder during the Maunder Minimum.
  • The Subtropical High in the north Pacific shifts southward with decreasing temperature.

In Summary:

  • Droughts of multi-year durations dominated northern China during 1628-1644, associated with the low solar activity and cold conditions of the Maunder Minimum.
  • The Droughts led to widespread famines,a general collapse of social order and political change.

My question is, if we have another grand minimum like the Maunder, will we have long term drought and a general collapse of social order when millions are starving?

Watts Up With That?

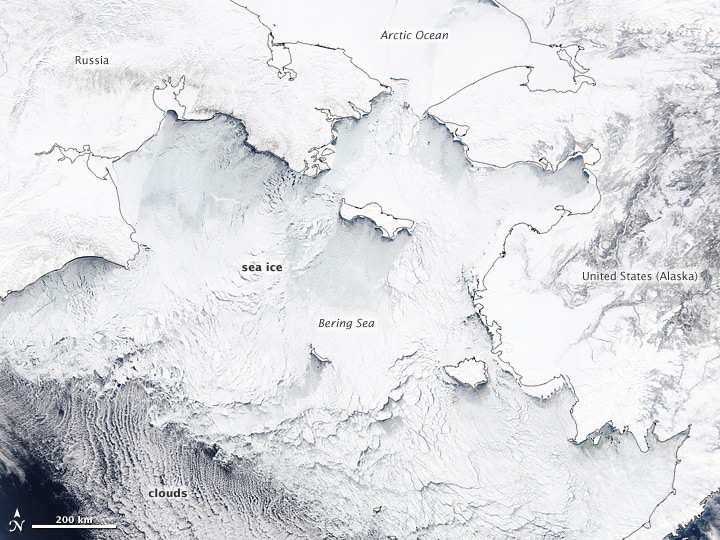
NASA reports in Bering Sea Teeming with Ice that “…the Bering Sea has been choking with sea ice. ”

Bering Sea Teeming with Ice

acquired March 19, 2012 download large image (12 MB, JPEG, 6800×8800)
acquired March 19, 2012 download GeoTIFF file (95 MB, TIFF)
acquired March 19, 2012 download Google Earth file (KMZ)

For most of the winter of 2011–2012, the Bering Sea has been choking with sea ice. Though ice obviously forms there every year, the cover has been unusually extensive this season. In fact, the past several months have included the second highest ice extent in the satellite record for the Bering Sea region, according to the National Snow and Ice Data Center (NSIDC).

The natural-color image above shows the Bering Sea and the coasts of Alaska and northeastern Siberia on March 19, 2012. The image was acquired by the Moderate Resolution Imaging Spectroradiometer (MODIS) on NASA’s Aqua satellite. Black lines mark…

View original post 2,126 more words

NASA Satellite Debunks Melting Glacier Myth

Russ Steele

Doug L. Hoffman writing at the Resilient Earth has the details:

One of the claims put forth by climate change alarmists is that Earth’s glaciers are rapidly melting. This supposedly causes all sorts of problems, from rising sea levels to failing water supplies. A recent report in the journal Nature uses NASA’s Gravity Recovery and Climate Experiment (GRACE) satellite to measure the loss of glacial ice around the globe. Analysis of the satellite data on Earth’s changing gravity field delivers some unexpected results and the results have surprising implications for both the global contribution of glaciers to sea level and the changes occurring in the mountain regions of Asia.

The story of melting glaciers has been told ad nauseam by climate catastrophists and the scientifically gullible news media for years. This blog has reported on the purported “rapid melting” of the Himalayan glaciers several times before (see “Himalayan Glaciers Not Melting” and “Himalayan Glacier Disappearance Overstated”). It is true that glaciers melt, they are the primary source of water in a number of regions around the world.

As I have often stated, this is an interglacial period, ice is supposed to melt. Otherwise there would still be a mile of ice on top of New York City. But despite evidence to the contrary, warmists continue to claim that glaciers are disappearing at an alarming rate. According to an accompanying News & Views article appearing in the same issue by Jonathan Bamber, from the Bristol Glaciology Centre:

Continue reading

Grand Minimum of Maunder Category Possible

Russ Steele

I received a nice comment from Jan-Erik Solheima letting me know that the following paper has finally been published and it is available HERE. A pdf version is also available.

Abstract: 

Relations between the length of a sunspot cycle and the average temperature in the same and the next cycle are calculated for a number of meteorological stations in Norway and in the North Atlantic region. No significant trend is found between the length of a cycle and the average temperature in the same cycle, but a significant negative trend is found between the length of a cycle and the temperature in the next cycle. This provides a tool to predict an average temperature decrease of at least from solar cycle 23 to solar cycle 24 for the stations and areas analyzed. We find for the Norwegian local stations investigated that 25-56% of the temperature increase the last 150 years may be attributed to the Sun. For 3 North Atlantic stations we get 63-72% solar contribution. This points to the Atlantic currents as reinforcing a solar signal.

——-

Highlights from an article at ICECAP:

* A longer solar cycle predicts lower temperatures during the next cycle.

* A 1 C or more temperature drop is predicted 2009–2020 for certain locations.

* Solar activity may have contributed 40% or more to the last century temperature increase.

* A lag of 11 years gives maximum correlation between solar cycle length and temperature.

Our analysis shows the variation in the length of solar cycles, we realize that short cycles like the one that ended in 1996, have only been observed three times in 300 years. After the shortest cycles, sudden changes too much longer cycles have always taken place, and thereafter there is a slow shortening of the next cycles, which take many cycles to reach a new minimum. This recurrent pattern tells us that we can expect several long cycles in the next decades. Analysis of the SCL back to 1600 has shown a periodic behavior with period 188 year, now entering a phase with increasing SCL the next (Richards et al., 2009).

de Jager and Duhau (2011) concludes that the solar activity is presently going through a brief transition period (2000–2014), which will be followed by a Grand Minimum of the Maunder type, most probably starting in the twenties of the present century. Another prediction, based on reduced solar irradiance due to reduced solar radius, is a series of lower solar activity cycles leading to a Maunder like minimum starting around 2040 (Abdussamatov, 2007). [ My emphasis added ]

See the entire study which goes into great detail for many Northwest Europe and arctic region temperatures. They find little correlation with the current cycle but significant correlation with the following cycle. There work suggests temperatures should accelerate down this decade – an 11 year lag with the minimum of ultra long cycle 23 (12.5 years) was in 2008 would mean significant cooling by 2018.

The real issue for me is, are our political leaders paying any attention.  If David Archibald is right, and this cooling significantly reduces agricultural out put, then millions may starve. Our current food production is being stressed due to increases in global population. While is true farmers have been tools than they did in the 1600s, there are far more mouths to feed to day, than during the Maunder. More in Archibald’s prediction in a future post.

Watts Up With That?

Monckton vanquishes Union College “Greens too yellow to admit they’re really Reds”

Guest post by Justin Pulliam

THE NEWS that Lord Monckton was to give his “Climate of Freedom” lecture at Union College in Schenectady, New York, had thrown the university’s environmentalists into a turmoil. The campus environmentalists set up a Facebook page announcing a counter-meeting of their own immediately following Monckton’s lecture. There is no debate about global warming, they announced. There is a consensus. The science is settled. Their meeting would be addressed by professors and PhDs, the “true” scientists, no less. Sparks, it seemed, were gonna fly.

View original post 3,430 more words

The long sunspot cycle 23 predicts a significant temperature decrease in cycle 24

Russ Steele

Norway scientists Jan-Erik Solheim, Kjell Stordahl & Ole Humlum have submitted a paper showing a relationship between solar activity and earth based temperatures in Norway.

Abstract

Relations between the length of a sunspot cycle and the average temperature in the same and the next cycle are calculated for a number of meteorological stations in Norway and in the North Atlantic region. No significant trend is found between the length of a cycle and the average temperature in the same cycle, but a significant negative trend is found between the length of a cycle and the temperature in the next cycle. This provides a tool to predict an average temperature decrease of at least 1.0 ◦C from solar cycle 23 to 24 for the stations and areas analyzed. We find for the Norwegian local stations investigated that 25–56% of the temperature increase the last 150 years may be attributed to the Sun. For 3 North Atlantic stations we get 63–72% solar contribution. This points to the Atlantic currents as reinforcing a solar signal.

The full paper can be downloaded HERE.  If this relationship works in Norway, it must also have a similar impact in other regions of the county, though over a variable range of temperatures.  We can expect lower temperatures as Solar Cycle 24 continues, though at a much lower level than past cycles.   The authors conclude:

Our forecast indicates an annual average temperature drop of 0.9◦C in the Northern Hemisphere during solar cycle 24. For the measuring stations south of 75N, the temperature decline is of the order 1.0-1.8◦C and may already have already started. For Svalbard a temperature decline of 3.5◦C is forecasted in solar cycle 24 for the yearly average temperature. An even higher temperature drop is forecasted in the winter months (Solheim et al., 2012).

Artic amplification due to feedbacks because of changes in snow and ice cover has increased the temperature north of 70N a factor 3 more than below 60N (Moritz et al., 2002). An Artic cooling may relate to a global cooling in the same way, resulting in a smaller global cooling, about 0.3-0.5 ◦C in SC24.

Our study has concentrated on an effect with lag once solar cycle in order to make a model for prediction. Since solar forcing on climate is present on many timescales, we do not claim that our result gives a complete picture of the Sun’s forcing on our planet’s climate.

Stay tuned!

More Proof that Cosmic Rays Influence Our Climate

Russ Steele

Nigel Calder writes on his Calder Updates blog there is now more proof that cosmic rays influence the earth’s climate.  Calder co-wrote The Chilling Stars, with Henrik Svensmark, who conducted the initial experiments on cosmic ray cloud formation. The CLOUD experiment at CERN  gave additional support to the theory that cosmic ray aid cloud formation. But, not all scientist were convinced, pointing to the lack of conditions that would lead to the growth of additional aerosols in the atmosphere. Now Svensmark and two of his colleagues in Denmark’s National Space Institute in Copenhagen, Martin Enghoff and Jens Olaf Pepke Pedersen have submitted a paper to Physical Review Letters demonstrating that there is a growth mechanism.

Abstract: In experiments where ultraviolet light produces aerosols from trace amounts of ozone, sulphur dioxide, and water vapour, the number of additional small particles produced by ionization by gamma sources all grow up to diameters larger than 50 nm, appropriate for cloud condensation nuclei. This result contradicts both ion-free control experiments and also theoretical models that predict a decline in the response of larger particles due to an insufficiency of condensable gases (which leads to slower growth) and to larger losses by coagulation between the particles. This unpredicted experimental finding points to a process not included in current theoretical models, possibly an ion-induced formation of sulphuric acid in small clusters.

A preprint is available on arXiv here: http://arxiv.org/abs/1202.5156v1

The observational evidence is now more secure:

Supernova remnants → cosmic rays → solar modulation of cosmic rays → variations in cluster and sulphuric acid production → variation in cloud condensation nuclei → variation in low cloud formation → variation in climate.

It is important to note that sunspots, or the lack of sunspots, influences the “solar modulations of cosmic rays” Fewer spots allows more cosmic rays to encourage cloud formation and influence the climate. More spots excite the earths magnetosphere which can deflect cosmic rays, resulting in fewer clouds and more sunshine, thus a warmer earth.   As the spots vanish, more cosmic rays –> more clouds –> a cooler earth. We can expect more cooling if the sunspots totally vanish some where beyond 2015 as predicted by Livingston and Penn. Their paper is here: Livingston-penn-2010

The Sun In A Funk- Sun Spots Not Rising (Updated 03-02)

Russ Steele

Anthony Watts has the story at WUWT in his post: The sun is still in a funk: sunspot numbers are dropping when they should be rising

I suggest interested readers check out the whole post at WUWT.  It has some interesting graphics that indicate the sun is not on a normal course. It is beginning to look more like the start of the Next Grand Minimum. Solar Cycle-24 is beginning to look like SC-5 or SC-6.

Here is an over lay of solar cycle 5 which was the beginning of the Dalton Minimum with the solar cycle 24:

This graphic is from “Beyond Landscheidt”   Since our ability to see spots today is greater than it was a century ago, a group has develop a Layman’s Count that only counts spots large enough to have been seen before. This is a little like hurricane and tornado counts which are higher today because we have better technology to see them.  The Layman’s Count has this cycle looking like cycle 5 in the early 1800s. Interestingly that cycle had an early spike like this one and then relaxed into a long, low plateau max and then long minimum.

We maybe on the cusp of the next grand minimum. The question is it a Dalton like minimum or a Maunder like.  As noted in the comments, Livingston and Penn have detected a decline the magnetic fields that was not evident during the Dalton.