Some Serious Space Weather at Play.

View at Medium.com

Popular Science has the details:

That Time a Bunch of Underwater Mines Exploded and the Sun Was the Only Suspect

Explosives going off without warning is bad news for… well, for everybody. So imagine the U.S. military’s alarm when, on August 4, 1972, it witnessed about two dozen or so spontaneous explosions in the waters off Hon La in North Vietnam. America’s Operation Pocket Money had dropped underwater mines there many weeks before to deter trade ships from venturing to North Vietnam ports. But the mines were only supposed to detonate when ships were around, and Americans surveilling the water from overhead were only seeing clear blue when the bombs went off.

Initially, the explosions were inexplicable. What could have possibly set the mines off? Big marine animals? Equipment malfunctions? Were the North Vietnamese using a secret strategy to blow up the mines remotely?

Over four-and-a-half decades later, we now know the culprit was the sun. According to findings recently published in the journal Space Weather, a powerful solar storm likely triggered the mines’ magnetic sensors and caused them to explode.

“It was a storm of magnificent proportions,” says Delores Knipp, a space weather researcher at the University of Colorado, Boulder and the lead author of the new paper. “It was a big story back in the day, and continues to be a big story.” The storm occurred in between Apollo missions 16 and 17, but it’s generally accepted that the radiation dose would have incapacitated (if not outright killed) astronauts traveling to and from the moon. In addition, other studies on the solar storm found the resulting geomagnetic current created many different power fluctuations in North America. “It’s been a storm that has been known for different effects in different communities.”

Continue reading HERE.

The article concludes:

But Knipp says a general estimation, based on current knowledge, is that these sorts of solar storms hit Earth about once every 70 years — “often enough that we need to be thinking about what types of technologies are subject to harm in these kinds of environments.” The question isn’t really if a storm powerful enough to knock out the power grid and wreck our technological equipment will hit us — but when it will happen, and whether we’ll be ready in time to prepare and safeguard our infrastructure.

I follow space weather on YouTube daily on the Suspicious Observer channel and weekly on space physicist Tamitha Skov’s channel. We should all pay close attention to our unstable star.

View at Medium.com

Plasma flow near the sun’s surface explains sunspots, other solar phenomena

Understanding the previously mysterious properties of the sun.
Every 11 years or so, the Sun’s magnetic field completely flips. This means that the Sun’s north and south poles switch places. Then it takes about another 11 years for the Sun’s north and south poles to flip back again.

The solar cycle affects activity on the surface of the Sun, such as sunspots which are caused by the Sun’s magnetic fields. Until now, various theories have tracked sunspots, but unable to explain why the number of spots peaks every 11 years.

In an effort to understand it, scientists at the University of Washington have proposed a model of plasma motion to explain the 11-year sunspot cycle and several other previously mysterious properties of the Sun.

Scientists created this model by relying on their previous work with fusion energy research. The model demonstrates that a slight layer underneath the Sun’s surface is key to many highlights we see from Earth, such as sunspots, magnetic reversals, and solar flow.

The fusion reactor uses very high temperatures similar to those inside the Sun to separate hydrogen nuclei from their electrons. In both the Sun and in fusion reactors, the nuclei of two hydrogen atoms fuse, releasing vast amounts of energy.

The type of reactor scientists have focused on; a spheromak contains the electron plasma within a sphere that causes it to self-organize into specific patterns. When they began to consider the Sun, they observed similarities and created a model for what might be happening in the celestial body.

First author Thomas Jarboe, a UW professor of aeronautics and astronautics, said, “Our model is completely different from a normal picture of the Sun. I think we’re the first people that are telling you the nature and source of solar magnetic phenomena—how the Sun works.”

In the new model, a thin layer of magnetic flux and plasma, or floating electrons, moves at different speeds on a different part of the Sun. The distinction in speed between the flows makes bits of magnetism, known as magnetic helicity, that are similar to what happens in some fusion reactor concepts.

Jarboe said, “Every 11 years, the Sun grows this layer until it’s too big to be stable, and then it sloughs off. Its departure exposes the lower layer of plasma moving in the opposite direction with a flipped magnetic field.”

“When the circuits in both hemispheres are moving at the same speed, more sunspots appear. When the circuits are different speeds, there is less sunspot activity. That mismatch may have happened during the decades of little sunspot activity known as the “Maunder Minimum.”

“If the two hemispheres rotate at different speeds, then the sunspots near the equator won’t match up, and the whole thing will die.”

“Scientists had thought that a sunspot was generated down at 30 percent of the depth of the Sun, and then came up in a twisted rope of plasma that pops out. Instead, his model shows that the sunspots are in the “supergranules” that form within the thin, subsurface layer of plasma that the study calculates to be roughly 100 to 300 miles (150 to 450 kilometers) thick, or a fraction of the Sun’s 430,000-mile radius.”

“The sunspot is an amazing thing. There’s nothing there, and then all of a sudden, you see it in a flash.”

“Other properties explained by the theory include flow inside the Sun, the twisting action that leads to sunspots and the entire magnetic structure of the Sun. The paper is likely to provoke intense discussion.”  [Emphasis added]

“I hope that scientists will look at their data in a new light, and the researchers who worked their whole lives to gather that data will have a new tool to understand what it all means.”

The study describing the model is published in the journal Physics of Plasmas

Another link to the paper:  https://aip.scitation.org/doi/10.1063/1.5087613

Question:  How does this model fit with Professor Valentina Zharkova model of the sun with four plasma layers?  I may have to find the time to re-read the Professors paper and compare. If a reader gets the paper read before I do please post your analysis in the comments. Thanks.

Parker Solar Probe Becomes Fastest-Ever Spacecraft

Parker Solar Prob
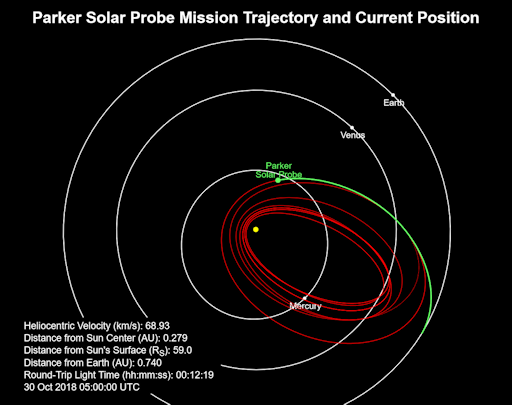
At about 10:54 p.m. EDT, Parker Solar Probe surpassed 153,454 miles per hour — as calculated by the mission team — making it the fastest-ever human-made object relative to the Sun. This breaks the record set by the German-American Helios 2 mission in April 1976.

Parker Solar Probe will repeatedly break its own records, achieving a top speed of about 430,000 miles per hour in 2024.

Source: NASA 

More details from NASA:

Parker Solar Probe will swoop to within 4 million miles of the sun’s surface, facing heat and radiation like no spacecraft before it. Launching in 2018, Parker Solar Probe will provide new data on solar activity and make critical contributions to our ability to forecast major space-weather events that impact life on Earth.

In order to unlock the mysteries of the corona, but also to protect a society that is increasingly dependent on technology from the threats of space weather, we will send Parker Solar Probe to touch the Sun.

In 2017, the mission was renamed for Eugene Parker, the S. Chandrasekhar Distinguished Service Professor Emeritus, Department of Astronomy and Astrophysics at the University of Chicago. In the 1950s, Parker proposed a number of concepts about how stars—including our Sun—give off energy. He called this cascade of energy the solar wind, and he described an entire complex system of plasmas, magnetic fields, and energetic particles that make up this phenomenon. Parker also theorized an explanation for the superheated solar atmosphere, the corona, which is – contrary to what was expected by physics laws — hotter than the surface of the sun itself. This is the first NASA mission that has been named for a living individual.

Parker can provide significant scientific insight into the next grand minimum, thus we will follow the program and the results on this blog. The first data dump will come in early December.

Parker will plunge toward the sun 24 more times in the next 8 years, breaking many records en route, and provide the scientist an opportunity to observe the next grand minimum up close if we are on the cusp of the Next Grand Minimum. Here’s the timeline.

Parker orbit_strip

H/T to Spaceweather.com with more details.

Stay tuned this is going to be an exciting venture into grand minimum science.

A Mystery In The Mesosphere

This summer, something strange has been happening in the mesosphere. The mesosphere is a layer of the atmosphere so high that it almost touches space. In the rarefied air 83 km above Earth’s surface, summertime wisps of water vapor wrap themselves around specks of meteor smoke. The resulting swarms of ice crystals form noctilucent clouds (NLCs), which can be seen glowing in the night sky at high latitudes.

More Details HERE.

During the first half of August 2018, reports of NLCs to Spaceweather.com have tripled compared to the same period in 2017. The clouds refuse to go away.

Researchers at the University of Colorado may have figured out why. “There has been an unexpected surge of water vapor in the mesosphere,” says Lynn Harvey of Colorado’s Laboratory for Atmospheric and Space Physics (LASP). This plot, which Harvey prepared using data from NASA’s satellite-based Microwave Limb Sounder (MLS) instrument, shows that the days of late July and August 2018 have been the wettest in the mesosphere for the past 11 years:

mls2_strip

In addition to being extra wet, the mesosphere has also been a bit colder than usual, according to MLS data. The combination of wet and cold has created favorable conditions for icy noctilucent clouds.

Water vapor is the primary greenhouse gas, even in the mesosphere.

Our Planet Is Being Roasted By Cosmic Rays From This Binary Star System Only 10,000 Light-Years Away

For years, Earth has been bombarded by cosmic rays emanating from a mysterious source astronomers couldn’t identify. Now, new research conducted with the help of NASA’s NuSTAR space telescope has finally tracked down the source of these rays: Eta Carinae, a binary star system just 10,000 light-years away. In an event called the Great Eruption of 1838, the system created a stunning hourglass nebula in a tremendous burst of energy that temporarily made it the second-brightest object in the night sky.

According to Fiona Harrison, the principal investigator of NuSTAR: “We’ve known for some time that the region around Eta Carinae is the source of energetic emission in high-energy X-rays and gamma rays. But until NuSTAR was able to pinpoint the radiation, show it comes from the binary and study its properties in detail, the origin was mysterious.”

The powerful cosmic radiation is caused, in part, by two currents of stellar wind colliding as they swirl around the twin stars. These winds then create shockwaves that boost the strength of the X-rays and gamma rays also being emitted. According to Kenji Hamaguchi, of NASA’s Goddard Space Flight Center: “We know the blast waves of exploded stars can accelerate cosmic ray particles to speeds comparable to that of light, an incredible energy boost. Similar processes must occur in other extreme environments. Our analysis indicates Eta Carinae is one of them.”

Discovering the source of these cosmic rays helps astronomers to understand a bit more about Eta Carinae, which is still something of a mystery: scientists have no idea what caused its famous “eruption” in 1838 which, by all rights, should have ended in a supernova.

Although Earth’s magnetosphere keeps us safe from (most) radiation, cosmic rays might actually be increasing around our planet. This makes space travel more deadly than it already is. And if the amount of radiation keeps increasing, we might find out the limits of our atmosphere the hard way.

Source article HERE.

Cosmic rays are increasing,

newhampshirevscalifornia_strip

According to space weather, Cosmic Rays are increasing and that may influence the amount of cloud cover.  n increase in cloud cover could cool the planet. More cosmic rays, more clouds, more cooling. Interesting that cooling maybe influenced by an external source, a binary star 10,000 light years away.

The question is how long will the increase continue? If the cosmic ray cloud connection is valid science, we could be in for some serious cold events.  The sun moderates the flow of cosmic rays, but the source is increasing, so how much can a quiet sun moderate? We live in interesting times.

Are El Ninos Fueled By Deep-Sea Geological Heat Flow?

El Niño and La Niña weather patterns have a significant impact on California climate. This illustration shows the drought impacts.

west-with-out-water-page-54

Long-term La Niña periods have been associated with long-term droughts in the southwest lasting 200, 90 and 55 years. More specifically severe droughts from AD1021 to 1051, AD1130 to 1180, AD1240 to 1265, AD1360 to 1365.

I often wondered what was the controlling mechanism that generated long-term La Niña conditions with few La Niño conditions. Plate Climatology Theory may be one possible answer, the generation of La Niña events by undersea volcanic activity.

I found this article on Plate Climatology most interesting.

eruptive-warm-burst

Geologically induced “Eruptive” warm burst that helps generate 2014-2015 El Nino.

All El Ninos originate at the same fixed “Point Source” located east of Papua New Guinea and the Solomon Islands. Fixed point sources are typical of geological features, and not typical of ever moving atmospheric or ocean current energy sources.

The Papua New Guinea / Solomon Island area is the most geologically active (volcanic eruptions and earthquakes), and complex deep-ocean regions on earth.

The shape/map pattern of El Nino sea surface temperature anomalies are unique / one of a kind. These shapes do not match every changing atmospheric or ocean current shapes/map patterns.

The El Nino sea surface temperature anomalies have “linear” and “intense” boundaries inferring that the energy source is fixed at one point, and is very powerful.

The shape/distribution pattern of super-heated and chemically charged fluid flow from fixed point source deep-ocean hydrothermal vents is a very good mini-analogy of the larger El Nino ocean warming shapes/distribution patterns.

The shape/distribution pattern of super-heated and chemically charged fluid flow from fixed point source large continental/dry land volcanic eruptions is a fair analogy of El Nino ocean warming patterns.

The amount of energy needed to generate an El Nino can be mathematically modeled using a 20-by-30-mile volcanically/earthquake-active deep-sea area (“point source”). The measured energy released from the Yellowstone Plateau, a 20-by-30-mile area, is a good mathematical analogy.

El Ninos do not occur in a predictable historical pattern, rather they occur randomly. This is indicative of a geological forces origin such as volcanic eruptions which are not predictable.

El Nino-like events do not occur elsewhere in Pacific. Why? If they are atmospheric in origin, there should at least be other mini-El Ninos elsewhere. There are none.

La Niñas originate from the same fixed point source as El Ninos. This implies both are geological in nature. La Niñas represents the cooling fluid flow phase from a geological feature.

Atmospherically based El Nino computer prediction models consistently fail, likely because they are modeling the “effects” of geologically heated oceans and not the root “cause” of the El Ninos.

Historical records indicate that the first “recorded” El Nino occurred in 1525 observed by Spanish explorers. Other studies suggest strong ancient El Ninos ended Peruvian civilizations.

The main point here is that strong El Ninos are natural, and not increasing in relationship to global warming as contended by many activist climate scientists.

Your thoughts?  Does this make sense?  Could sunspots have an influence on plate tectonics?

A massive hole just opened up in Antarctica’s ice and scientists can’t explain it

antarctic hole

Thanks to its usefulness as an indicator of how badly humans are messing up the Earth with global warming, scientists like to keep a pretty close eye on the ice in Antarctica. Now, a massive hole the size of Lake Superior has appeared many miles inland from where the ice meets the ocean, and scientists have little concrete explanation as to why it’s there.

The hole, which is called a polynya, is incredibly puzzling because of its odd behavior. This isn’t the first time it’s been spotted, having appeared last year for a brief period as well, and long before that it was detected back in the 1970s. However, it disappeared for several decades before showing back up, throwing a huge kink in many scientific explanations for its existence.

Source

Could the story above be related to this story below on undersea volcanos?

More than one million underwater volcanoes – Oregon State University

According to Oregon State University (OSU), there may be more than one million underwater volcanoes. Here’s how their website puts it:

“If an estimate of 4,000 volcanoes per million square kilometers on the floor of the Pacific Ocean is extrapolated for all the oceans than there are more than a million submarine (underwater) volcanoes. Perhaps as many as 75,000 of these volcanoes rise over half a mile (1 kilometer) above the ocean floor.”

Your thoughts? Are they related?

Sunspots and Volcanos?[Updated]

Anthony Mengotto in a comment brought up and interesting point, the sun is growing quiet, while volcanism is increasing. I have always wondered it there was a connection. Does vulcanism fluctuate with the increase and decrease of sunspots? The Smithsonian/USGS Weekly reports go back to the winter of 2000, which covers the Solar Cycle 23 peak and Solar Cycle 24 peak. This data allowed me to take a median date for the peaks and compare with the number of active volcanos. I did the same for Solar Cycle 23 minimum and the most recent measurement as Solar Cycle 24 seeks the minimum. The results are in the chart below.

solar_spots_volcanos

It looks like there could be a relationship, high spots lower vulcanism, fewer spots higher vulcanism.

I picked the mid-point of the high spot count and low spots just to test the idea. There was a lot of variation in the numbers, so a more valid analysis might be to pick four fixed points in each year and plot the results on a graph of the sunspots. Plus, minimum is not until 2019 -2020.  I will use this analysis as a Python learning project, so stay tuned.

Readers thoughts are most welcome.

Update: this is the chart that got me thinking about grand minimums and volcanos:

Volcanic activity

Solar Cycles: The Bray (Hallstatt) Cycle

This is a link to a guest essay by Andy May and Javier at Watts Up With That

The evidence for a persistent irregular climate cycle with a period of 2400 ±200 years is strong. There is compelling evidence of a solar cycle of about the same length and phase; suggesting that the solar cycle might be causing the climate cycle. We will present a summary of the evidence, beginning with the original paleontological evidence, followed by the cosmogenic radionuclide (10Be or Beryllium-10 and 14C or Carbon-14) evidence. For more information, a bibliography of many papers discussing topics relevant to the Bray (Hallstatt) cycle can be found here. Only a small portion of the relevant papers are mentioned in this summary post.

This is the section that mentions solar grand minimums and maximums

The Bray cycle appears to be closely tied to tight clusters of grand solar maxima and minima. The Little Ice Age Wolf, Spörer, Maunder and Dalton grand minima are the best example of a solar grand minima cluster and they fall in a Bray low. The Greek Dark Age and the Homer grand minimum also fall in a Bray low. Significant historical events that fall in Bray lows are labeled in figure 2. A more complete picture of these events can be found here. The Little Ice Age (LIA) is a well-known cold period filled with plagues and suffering due to cold, for more details see here and in Dr. Wolfgang Behringer’s excellent book. The period labelled “GDA” is the Greek Dark Ages, during this Bray low the Late Bronze Age ended and after a period of civilization collapse, the Early Iron Age started. The “Uruk” Bray low event corresponds with the expansion of the Uruk civilization and the growth of some of the world’s first cities. Near the end of the Uruk Bray low, the Middle East transitions from the Copper Age to the Early Bronze Age and cuneiform writing appears.

You can read the full text of this interesting essay HERE. I also found the comments on this essay by Andy May and Javier very interest and worth your time to review. It is clear we have multiple solar cycles creating a complex mix of overlapping cycles, where the sum of the influence waxes and wains over time. We live in a complex universe.

Little Ice Age Theory

By James A. Marusek, Retired U.S. Navy Physicist who is warning us of what is to come.

I. Introduction

General Discussion
The sun is undergoing a state change. It is possible that we may be at the cusp of the next Little Ice Age. For several centuries the relationship between periods of quiet sun and a prolonged brutal cold climate on Earth (referred to as Little Ice Ages) have been recognized. But the exact mechanisms behind this relationship have remained a mystery. We exist in an age of scientific enlightenment, equipped with modern tools to measure subtle changes with great precision. Therefore it is important to try and come to grips with these natural climatic drivers and mold the evolution of theories that describe the mechanisms behind Little Ice Ages.

The sun changes over time. There are decadal periods when the sun is very active magnetically, producing many sunspots. These periods are referred to as Solar Grand Maxima. And then there are periods when the sun is very weak producing few sunspot. These periods are called Solar Grand Minima. Solar Grand Minima correspond to dark cold glooming periods called Little Ice Ages. And there are states in-between. During most of the 20th century, the sun was in a Solar Grand Maxima. But that came to an abrupt end beginning in July 2000. The sun produced 6 massive explosions in rapid succession. Each of these explosions produced solar proton events with a proton flux greater than 10,000 pfu @ >10 MeV. These occurred in July 2000, November 2000, September 2001, two in November 2001, and a final one in October 2003. And there hasn’t been any of this magnitude since. Then the sun produced one of the weakest solar minimums since the Ap Index was first recorded (beginning in 1932). The current solar cycle (Solar Cycle 24) is very weak. Not quite weak enough to be called a Solar Grand Minima but very close. It is analogous to a period referred to as a ‘Dalton Minimum’.

As we transitioned from a Grand Solar Maxima, which typified the 20th century to a magnetically quiet solar period similar to a Dalton Minimum (~1798-1823 A.D.), it gave us the opportunity to observe the changes in solar parameters across this transition.

I propose two mechanisms primarily responsible for Little Ice Age climatic conditions. These two components are Cloud Theory and Wind Theory. At the core of Cloud Theory are galactic cosmic rays (GCRs) and at the core of Wind Theory are diamond dust ice crystals. During Little Ice Ages, there is an increase of low level clouds that cause a general global cooling and an alteration of the jet streams that drives cold air from upper latitudes deep into the mid latitude regions.

Little Ice Age conditions are defined not only by colder temperatures but also by a shift in the patterns of wind streams. They produce long-lasting locked wind stream patterns responsible for great floods and great droughts. They also affect the cycle of seasons producing great irregularity and crop failures. Altered wind streams impacts the development of massive storms and hurricanes. These Little Ice Age conditions in the past caused poor crop yields, famines, major epidemics, mass migration, war, and major political upheavals.

Read the full document HERE: Little_Ice_Age_Theory

Be sure to read Appendix A which catalogs the climate extremes during the Maunder Minimum.  We are on the cusp of a Grand Minimum, Dalton or Maunder type, only time will tell.