The Sun’s Role in Climate Change

Dr. Nir Shaviv spoke at a Friends of Science event on June 2, 2015, on Solar Forcing. Dr. Shaviv explained and demonstrated that the sun is an important climate driver but it is missing from the standard climate analyses. As a consequence, the standard (i.e. IPCC) models have a much higher climate sensitivity than the real Earth has, such that future climate response to anthropogenic forcing will be “much more benign” than what alarmists claim.

A video of his talk is here:  https://youtu.be/YtCEW2shDSU

Dr. Nir Shaviv’s slides can be downloaded HERE.  Grand Minimums are mentioned on slide 27.


Next Maunder Minimum Predicted

Reposted from Watt’s Up With That

25 for 25

Guest post by David Archibald

Back on March 7, 2006, the National Science Foundation issued a press release predicting that the amplitude of Solar Cycle 24 would be “30 to 50 percent stronger” than Solar Cycle 23. Solar Cycle 23 had a smoothed maximum amplitude of 180.3. The press release described the forecast as “unprecedented”. Perhaps it was as in unprecedentedly wrong. Solar Cycle 24 had a smoothed maximum amplitude of 116.4 in April 2104, which made it 35% weaker than Solar Cycle 23.

NASA has recycled some of the language from that 2006 press release in this release on NASA researcher Irina Kitiashvili’s forecast of Solar Cycle 25 amplitude which includes this line:

The maximum of this next cycle – measured in terms of sunspot number, a standard measure of solar activity level – could be 30 to 50% lower than the most recent one.

This time it is 30 to 50% lower rather than higher which would put maximum smoothed amplitude in the range of 80 to 60. The graphics in Kitiashvili’s presentation differ from that. This graphic from slide nine has a peak amplitude of 50 with a range of 65 down to 40:

clip_image002

Figure 1: Solar Cycle 25 forecast in the context of 320 years of solar cycle data

But the graphic on the previous slide has a peak amplitude of 25:

clip_image003

Figure 2: Solar Cycle 25 amplitude forecast from slide 8

Let’s assume that the latter forecast of 25 is the author’s intent and apply it to the figure on slide 3 of 420 years of sunspot data:

clip_image005

Figure 3: Forecast from Figure 2 imposed on the 420 years of solar cycle data on slide 3.

In this figure the forecast from Figure 2 is scaled to fit on the graphic on slide 3 from Kitiashvili’s presentation. It shows that Solar Cycle 25 will be the smallest for some 300 years. The activity pattern predicted by Kitiashvili looks like the setup for the Maunder Minimum. A Maunder-like event was predicted by Schatten and Tobiska in their paper to the 34th meeting of the Solar Physics Division of the American Astronomical Society, June 2003:

The surprising result of these long range predictions is a rapid decline in solar activity, starting with cycle #24. If this trend continues, we may see the Sun heading towards a “Maunder” type of solar activity minimum – an extensive period of reduced levels of solar activity.”

NASA’s press release is headed “Solar Activity Forecast for Next Decade Favorable for Exploration”. So spacecraft electronics and spacemen will have a lower chance of being fried by solar storms, the Earth’s thermosphere will shrink, satellites will have lower drag and stay in orbit longer. But what about life on Earth? In her 2011 paper Haigh showed an unequivocal relationship between solar activity and climate as recorded in North Atlantic ocean sediments:

clip_image007

Figure 4: Records extracted from ocean sediments in the North Atlantic

In Figure 4 solar activity is measured by Be10 (purple) and climate variation is shown by deposits of ice-rafted minerals (orange). Lower solar activity means that it will become colder and colder is drier. Prepare accordingly.

David Archibald is the author of American Gripen: The Solution to the F-35 Nightmare.

[Emphasis added]

NASA – Next Solar Cycle will be Weakest in 200 Years

September 5, 2019 by Robert at Ice Age Now

NASA dropped this bombshell announcement in a little-heralded news release coyly entitled “Solar Activity Forecast for Next Decade Favorable for Exploration.” In other words, NASA tried to make it sound like good news.

In the release, dated 12 June 2019, NASA described the upcoming decline in solar activity as a window of opportunity for space exploration instead of acknowledging the disastrous consequences such a decline could wreak on civilization.

Here are some direct quotes from the news release:

The Sun’s activity rises and falls in an 11-year cycle. The forecast for the next solar cycle says it will be the weakest of the last 200 years. (Emphasis added) The maximum of this next cycle – measured in terms of sunspot number, a standard measure of solar activity level – could be 30 to 50% lower than the most recent one. The results show that the next cycle will start in 2020 and reach its maximum in 2025.

Sunspots are regions on the Sun with magnetic fields thousands of times stronger than the Earth’s. Fewer of them at the point of maximum solar activity means fewer dangerous blasts of radiation.

The new research was led by Irina Kitiashvili, a researcher with the Bay Area Environmental Research Institute at NASA’s Ames Research Center, in California’s Silicon Valley. It combined observations from two NASA space missions – the Solar and Heliospheric Observatory and the Solar Dynamics Observatory – with data collected since 1976 from the ground-based National Solar Observatory.

In admitting that solar activity during sunspot-cycle 25 could be the weakest in 200 years, NASA was effectively forecasting a return to Dalton Minimum (1790-1830) conditions. But the release gives no mention of the ferocious cold, no mention of the disastrous crop losses, no mention of the ensuing starvation and famine, no mention of the wars over food, no mention of the powerful earthquakes, no mention of the catastrophic volcanic eruptions during the Dalton Minimum.

NASA Paper is HERE

Some people consider the low solar activity a trigger for other catastrophic events such as the 1811-1812 New Madrid Fault Earth Quakes and 1815 eruption of Mount Tamboura.  As you can see from this chart global cooling produced some strong eruption.

Volcanic activity

I have done some investigation of the cooling triggering earthquakes and significant eruptions but could not find any smoking-gun evidence.  [Your thoughts?]

The said the real issue is global cooling, as  1-2 degrees C of cooling shortens the growing seasons and disrupts the food supply. This is a problem for a planet with more mouths to feed with every passing year.  Modern transportation can mitigate the distribution issues that plagued other grand minimum populations, but you first have to have agricultural output to distribute.  This year the growing season is going to be much shorter than last year. Your thoughts?

The Setup is like 1315

Guest Commentary by David Archibald at Watts Up With That

The area planted for corn and soybeans this season is well below historic averages. This was mostly due to waterlogged fields and flooding which precluded planting. The planting windows for corn and soybeans are now closed. The USDA crop progress reports provide weekly updates by state. For example this is the state of the corn crop in Indiana to Monday June 17:

clip_image002

Figure 1: Indiana corn crop progress to Monday June 17.

The emerged crop is one month behind where it was in 2018. Which means that maturity will be one month later at best, assuming that the rest of the summer isn’t abnormally cold.

Figure 2 shows that the same situation in soybeans in Indiana:

clip_image004

Figure 2: Indiana soybean crop progress to Monday June 17.

The current expectation is that the US corn crop will be down 30% on 2018 which will push the price to about $9.00 per bushel at harvest. What could make the situation a lot worse is an early frost. The Corn Belt did warm slightly over the last 100 years due to the high solar activity of the second half of the 20th century. This is shown by the cumulative growing degree days (GDD) of the first decade of the 20th century (blue lines) compared to the first decade of the 21st century (red lines) in Figure 3 for Whitestown, Indiana:

clip_image006

Figure 3: Cumulative GDD for Whitestown, Indiana

Normally, for the 21st century, the corn crop is in the ground by April 27 and the crop has reached maturity with 2,500 GDD well before the normal first frost date for Whitestown of October 10. The earliest recorded date for Whitestown is September 3. That was in 1908. If that is repeated in 2019 the crop will be only 80% through its growth cycle. Yield and quality will be well down and the total crop may be 50% or less of the 2018 level.

The US will be able to feed itself but at much higher prices. Currently some 40% of the corn crop goes to ethanol production and this could be redirected to animal feed without too much trouble. But protein production would still be well down. Each 56 lb bushel of corn used in ethanol production results in 18 lbs of dried distillers grains (DDG) containing the protein. This is used as a feed supplement to pigs, chickens and cattle. Both pigs and chickens have a 25% conversion efficiency of vegetable protein to animal protein. The global warmers want us to adopt vegetarianism in order to save the planet. The public is going to get a taste of that future coming up soon. However animal fat is essential for infant neurological development and brain function so we can’t go completely vegetarian.

What is happening in the Corn Belt is a mini version of the transition from the Medieval Warm Period to the Little Ice Age. The population of Europe exploded in benign conditions of the Medieval Warm Period from 1000 AD to 1300 AD, reaching population levels that weren’t matched again until the 19th century. In fact parts of rural France have less population today than at the beginning of the 14th century.

The breakover from the Medieval Warm Period to the Little Ice Age in Europe had sustained periods of bad weather characterised by severe winters and rainy and cold summers. The Great Famine of 1315 – 1317 started with bad weather in the spring of 1315. Crop failures lasted through 1316 until the summer of 1317. The population decline over the two years is thought to be about 10%, associated with “extreme levels of crime, disease, mass death, cannibalism and infanticide.” These conditions may be less in the Mormons amongst us who are instructed to keep one year’s worth of food in stock.

The Modern Warm Period ended in 2006. Current solar activity is back to levels of the Little Ice Age. To paraphrase Santayana, those who don’t remember history are condemned to being surprised and unprepared when it repeats itself.

A large and increasing number of nations are feeding their population growth with imported grain. That is going to be become more expensive to continue, with or without an early frost in the Corn Belt. Global warming hysteria has been a consequence of very benign conditions for the OECD countries where it is concentrated. That angst will be supplanted by more basic concerns.

David Archibald is the author of American Gripen: The Solution to the F-35 Nightmare

I am going to create a Google Alert to track early frost reports. I will share the results.

When will people realize that. . .


Ed Hoskins

  1. The modern short pulse of beneficial Global warming stopped 20 years ago and recent global temperatures are now stable or declining.
  2. The last millennium 1000 – 2000 AD was the coldest of our current Holocene interglacial and the world has already been cooling quite rapidly for the last 3000 years.
  3. At 11,000 years our Holocene interglacial, responsible for all man-kind’s advances, is reaching its end.
  4. The weather gets worse in colder times.
  5. The world will very soon (in geological time), revert to a true glaciation, again resulting in mile high ice sheets over New York.

Our current beneficial, warm Holocene interglacial has been the enabler of mankind’s civilization for the last 10,000 years.

The congenial climate of the Holocene epoch spans from mankind’s earliest farming to the scientific and technological advances of the last 100 years.

screen-shot-2018-10-08-at-15.49.41

However all the Northern Hemisphere Ice Core records  from Greenland show:

  • the last millennium 1000AD – 2000AD has been the coldest millennium of the entire Holocene interglacial.
  • each of the notable high points in the Holocene temperature record, (Holocene Climate Optimum – Minoan – Roman – Medieval – Modern), have been progressively colder than the previous high point.
  • for its first 7-8000 years the early Holocene, including its high point “climate optimum”, had virtually flat temperatures, an average drop of only ~0.007 °C per millennium.
  • but the more recent Holocene, since a “tipping point” at ~1000BC, has seen a temperature diminution at more than 20 times that earlier rate at about 0.14 °C per millennium.
  • the Holocene interglacial is already 10 – 11,000 years old and judging from the length of previous interglacials the Holocene epoch should be drawing to its close: in this century, the next century or this millennium.
  • the beneficial warming at the end of the 20th century to the Modern high point has been transmuted into the “Great Man-made Global Warming Alarm”.
  • eventually, this late 20th-century temperature blip will come to be seen as just noise in the system in the longer term progress of comparatively rapid cooling over the last 3000+ years.
  • other published Greenland Ice Core records as well as GISP2, (NGRIP1, GRIP) corroborate this finding. They also exhibit the same pattern of a prolonged relatively stable early Holocene period followed by a subsequent much more rapid decline in the more recent (3000 years) past.

When considering the scale of temperature changes that alarmists anticipate because of Man-made Global Warming and their view of the disastrous effects of additional Man-made Carbon Dioxide emissions in this century, it is useful to look at climate change from a longer term, century by century and even on a millennial perspective.

The much vaunted and much feared “fatal” tipping point of +2°C would only bring Global temperatures close to the level of the very congenial climate of “the Roman warm period”.

If it were possible to reach the “horrendous” level of +4°C postulated by Warmists, that extreme level of warming would still only bring temperatures to about the level of the previous Eemian maximum, a warm and abundant epoch when hippopotami thrived in the Rhine delta.

screen-shot-2015-06-06-at-12-34-16

Read the full paper HERE

The Little Ice Age: What Happened Around the World

Between 1300 and 1850, the Earth experienced a Little Ice Age whose cause to this day is not known.

A blog post at Interesting Engineering has more details including the consequences and some paintings from the period. The causes listed are interesting:

Causes

The causes of the LIA are still not known, while potential candidates are reduced solar output, changes in atmospheric circulation, and volcanism.

Low sunspot activity is associated with lower solar output, and two periods of unusually low sunspot activity occurred during the Little Ice Age: the Spörer Minimum (1450–1540) and the Maunder Minimum (1645–1715), which is named for astronomer E.W. Maunder who discovered the absence of sunspots during that period. Both of these coincide with the coldest years of the LIA in parts of Europe.

Another possible candidate is a reversal of the North Atlantic Oscillation (NAO). This is a large-scale atmospheric-circulation pattern over the North Atlantic and adjacent areas. During its “positive” phase, the track of North Atlantic storms is centered over the British Isles and Northern Europe. During its “negative” phase, cold Arctic air from Russia moves over northern Europe.

A final candidate is volcanic eruptions which propel gases and ash into the stratosphere, where they reflect incoming sunlight. In 1783, Iceland’s Laki volcano erupted, and in 1815, the Tambora volcano on Sumbawa Island erupted.

I am voting for low sunspot activity.  Your thoughts?

Little Ice Age Summary at WUWT

What’s Natural?

By Jim Steele

Extreme scientists and politicians warn we will suffer catastrophic climate change if the earth’s average temperature rises 2.7°F above the Little Ice Age average. They claim we are in a climate crisis because average temperature has already warmed by 1.5°F since 1850 AD. Guided by climate fear, politicians fund whacky engineering schemes to shade the earth with mirrors or aerosols to lower temperatures. But the cooler Little Ice Age endured a much more disastrous climate.

The Little Ice Age coincides with the pre-industrial period. The Little Ice Age spanned a period from 1300 AD to 1850 AD, but the exact timing varies. It was a time of great droughts, retreating tree lines, and agricultural failures leading to massive global famines and rampant epidemics. Meanwhile advancing glaciers demolished European villages and farms and extensive sea ice blocked harbors and prevented trade.

Dr. Michael Mann who preaches dire predictions wrought by global warming described the Little Ice Age as a period of widespread “famine, disease, and increased child mortality in Europe during the 17th–19th century, probably related, at least in part, to colder temperatures and altered weather conditions.” In contrast to current models suggesting global warming will cause wild weather swings, Mann concluded “the Little Ice Age may have been more significant in terms of increased variability of the climate”. Indeed, historical documents from the Little Ice Age describe wild climate swings with extremely cold winters followed by very warm summers, and cold wet years followed by cold dry years.

A series of Little Ice Age droughts lasting several decades devastated Asia between the mid 1300s and 1400s. Resulting famines caused significant societal upheaval within India, China, Sri Lanka, and Cambodia. Bad weather resulted in the Great Famine of 1315-1317 which decimated Europe causing extreme levels of crime, disease, mass death, cannibalism and infanticide. The North American tree-ring data reveal megadroughts lasting several decades during the cool 1500s. The Victorian Great Drought from 1876 to 1878 brought great suffering across much of the tropics with India devastated the most. More than 30 million people are thought to have died at this time from famine worldwide.

The Little Ice Age droughts and famines forced great societal upheaval, and the resulting climate change refugees were forced to seek better lands. But those movements also spread horrendous epidemics. Wild climate swings brought cold and dry weather to central Asia. That forced the Mongols to search for better grazing. As they invaded new territories they spread the Bubonic plague which had devastated parts of Asia earlier. In the 1300s the Mongols passed the plague to Italian merchant ships who then brought it to Europe where it quickly killed one third of Europe’s population. European explorers looking for new trade routes brought smallpox to the Americas, causing small native tribes to go extinct and decimating 25% to 50% of larger tribes. Introduced diseases rapidly reduced Mexico’s population from 30 million to 3 million.

By the 1700s a new killer began to dominate – accidental hypothermia. When indoor temperatures fall below 48°F for prolonged periods, the human body struggles to keep warm, setting off a series of reactions that causes stress and can result in heart attacks. As recently as the 1960s in Great Britain, 20,000 elderly and malnourished people who lacked central heating died from accidental hypothermia. As people with poor heating faced bouts of extreme cold in the 1700s, accidental hypothermia was rampant.

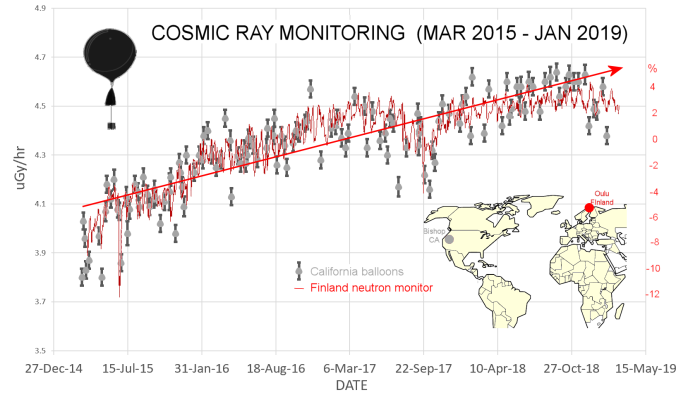
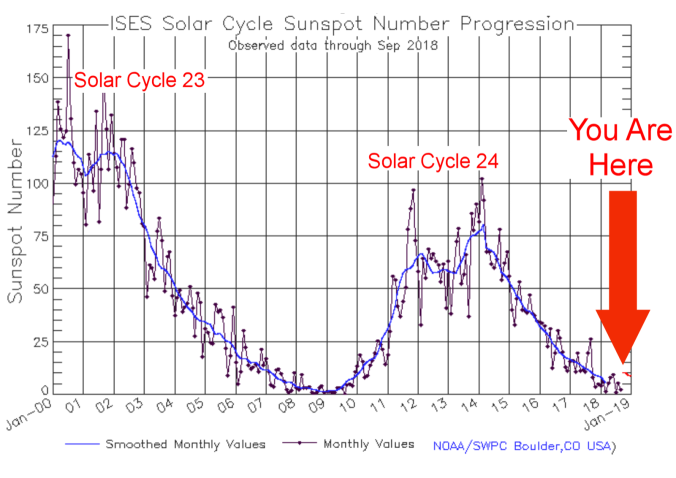
What caused the tragic climate changes of the Little Ice Age? Some scientists suggest lower solar output associated with periods of fewer sunspots. Increasing solar output then reversed the cooling and warmed the 20th century world. As solar output is now falling to the lows of the Little Ice Age, a natural experiment is now in progress testing that solar theory. However other scientists suggest it was rising CO2 that delivered the world from the Little Ice Age.

Increasing CO2 also has a beneficial fertilization effect that is greening the earth. The 20th century warming, whether natural or driven by rising CO2 concentrations, has lengthened the growing season. Famines are being eliminated. Tree-lines stopped retreating and trees are now reclaiming territory lost over the past 500 years. So why is it that now we face a climate crisis?

At the end of the 1300’s Great Famine and the Bubonic Plague epidemic, the earth sustained 350 million people. With today’s advances in technology and milder growing conditions, record high crop yields are now feeding a human population that ballooned to over 7.6 billion.

H/T to WUWT

The open question is: Will our technology save us from the next grand minimum and little ice age? Your thoughts?

Henrik Svensmark: FORCE MAJEURE The Sun’s Role in Climate Change

I am still studying this paper but wanted to share and get your feedback

Executive Summary

Over the last twenty years there has been good progress in understanding the solar influ- ence on climate. In particular, many scientific studies have shown that changes in solar activ- ity have impacted climate over the whole Holocene period (approximately the last 10,000 years). A well-known example is the existence of high solar activity during the Medieval Warm Period, around the year 1000 AD, and the subsequent low levels of solar activity during the cold period, now called The Little Ice Age (1300–1850 AD). An important scientific task has been to quantify the solar impact on climate, and it has been found that over the eleven- year solar cycle the energy that enters the Earth’s system is of the order of 1.0–1.5 W/m2. This is nearly an order of magnitude larger than what would be expected from solar irradiance alone, and suggests that solar activity is getting amplified by some atmospheric process.

Three main theories have been put forward to explain the solar–climate link, which are:
• solarultravioletchanges
• theatmospheric-electric-fieldeffectoncloudcover
• cloudchangesproducedbysolar-modulatedgalacticcosmicrays(energeticparticles originating from inter stellar space and ending in our atmosphere).

Significant efforts has gone into understanding possible mechanisms, and at the moment cosmic ray modulation of Earth’s cloud cover seems rather promising in explaining the size of solar impact. This theory suggests that solar activity has had a significant impact on climate during the Holocene period. This understanding is in contrast to the official consensus from the Intergovernmental Panel on Climate Change, where it is estimated that the change in solar radiative forcing between 1750 and 2011 was around 0.05 W/m2, a value which is en- tirely negligible relative to the effect of greenhouse gases, estimated at around 2.3 W/m2. However, the existence of an atmospheric solar-amplification mechanism would have im- plications for the estimated climate sensitivity to carbon dioxide, suggesting that it is much lower than currently thought.

In summary, the impact of solar activity on climate is much larger than the official consen- sus suggests. This is therefore an important scientific question that needs to be addressed by the scientific community.

Full paper at the GWPF website HERE.


Auroral Evidence of Upcoming Mini or Little Ice Age?

In a guess post at Watts Up With That on the cooling signals embedded in the Aurora Borealis, Dr Tim Ball concludes:

The current debate attracting more and more people is that we are cooling with the only question left as to the extent and intensity. Will it be [the] weather similar to the cooler period coincident with the Dalton Minimum from 1790 – 1830? Alternatively, will it be colder with similar conditions to those by the early fur traders in Hudson Bay or those that spanned the life of Sir Edmund Halley? The appearance of Aurora in northern England suggests the latter, although I can predict who will protest this suggestion.

This is an interesting analysis of historical documents.  Read the full story HERE.

In the comments Leif Svalgaard offered this:

The sun sends us several ‘messages’ about its activity. One [beautiful] one is the aurora which has been observed since antiquity. I recently gave a seminar on those messengers:

https://leif.org/research/Multi-Messenger-Solar-Physics-Through-Time.pdf

The aurorae evidence is very difficult to calibrate. I have not studied Svalgaard’s paper yet but its looks very interesting.

Looking forward to your comments on  the questions: Is the auroral evidence of the next grand minimum and a little ice age? 

Cosmic Rays Increasing for the 4th Year in a Row

Feb. 21, 2019: Cosmic rays in the stratosphere are intensifying for the 4th year in a row. This finding comes from a campaign of almost weekly high-altitude balloon launches conducted by the students of Earth to Sky Calculus. Since March 2015, there has been a ~13% increase in X-rays and gamma-rays over central California, where the students have launched hundreds of balloons.

neutronsandxrays2

The grey points in the graph are Earth to Sky balloon data. Overlaid on that time series is a record of neutron monitor data from the Sodankyla Geophysical Observatory in Oulu, Finland. The correlation between the two data sets is impressive, especially considering their wide geographic separation and differing methodologies. Neutron monitors have long been considered a “gold standard” for monitoring cosmic rays on Earth. This shows that our student-built balloons are gathering data of similar quality.

Why are cosmic rays increasing? The short answer is “Solar Minimum.” Right now, the 11-year solar cycle is plunging into one of the deepest minima of the Space Age. The sun’s weakening magnetic field and flagging solar wind are not protecting us as usual from deep-space radiation. Earth to Sky balloon launches in multiple countries and US states show that this is a widespread phenomenon.

solarcycle

Cosmic rays are of interest to anyone who flies on airplanes. The International Commission on Radiological Protection has classified pilots as occupational radiation workers because of cosmic ray doses they receive while flying. A recent study by researchers at the Harvard School of Public Health shows that flight attendants face an elevated risk of cancer compared to members of the general population. They listed cosmic rays as one of several risk factors. There are also controversial studies that suggest cosmic rays promote the formation of clouds in the atmosphere; if so, increasing cosmic rays could affect weather and climate.

Thanks to Dr. Phillips for sharing this post from Spaceweather.com  [Emphasis added]

The more cosmic rays the more clouds, which results in more cooling of the planet.